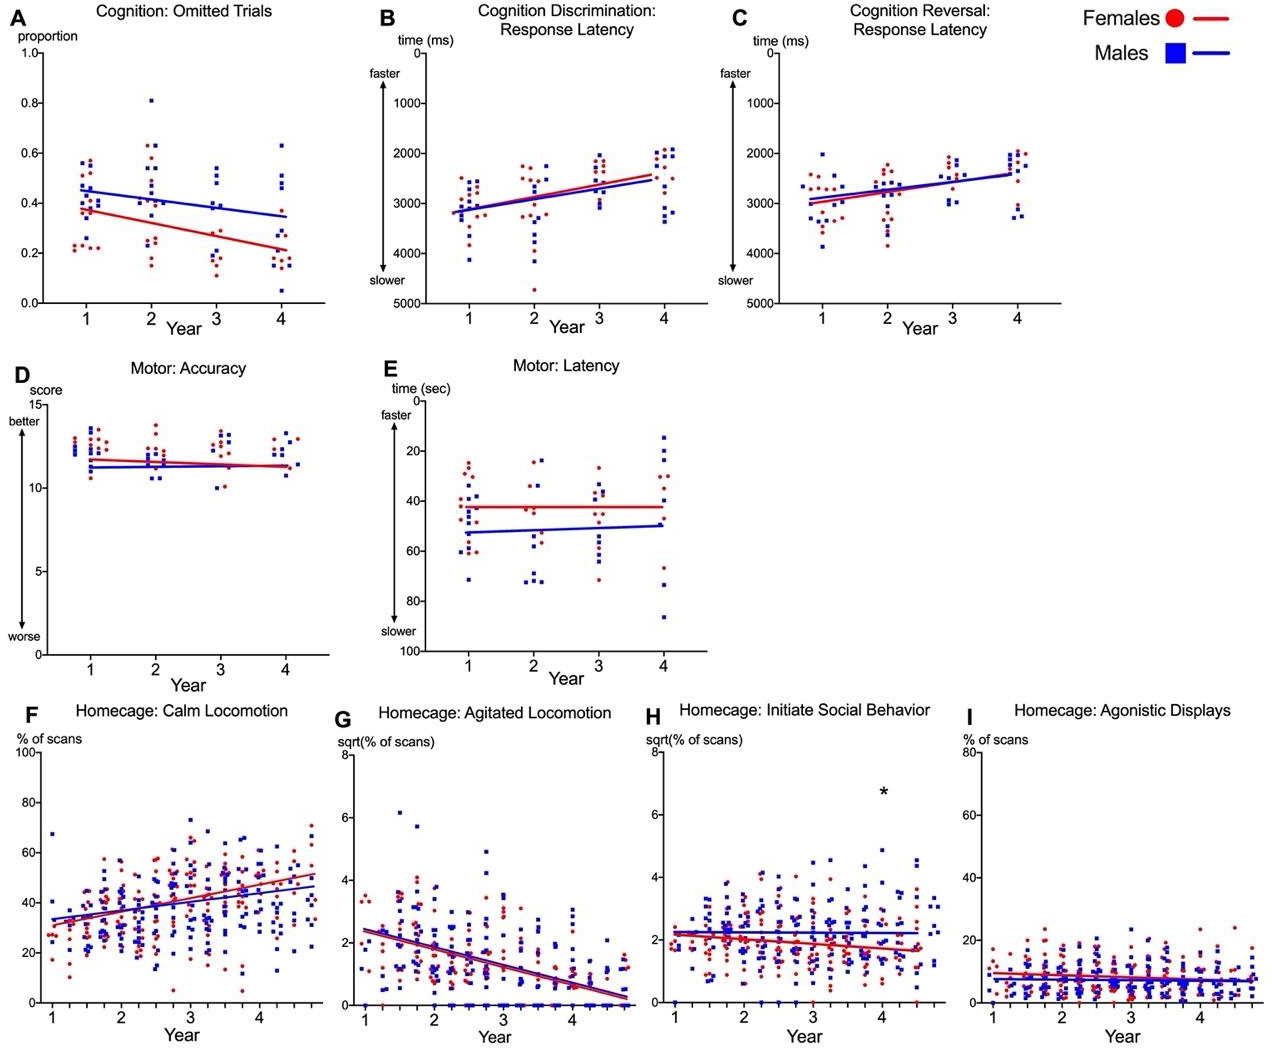
Figure 3. Aging trajectories for non-cognitive variables in marmosets.

Aging Trajectories in males (blue) and females (red) for: the proportion of omissions on all cognitive trials (A), response times for discrimination (B) and reversal (C) (Top panel); Motor accuracy and latency (D-E, Middle panel); Homecage behaviors (F-I, Bottom panel). Points represent averaged scores for individual marmosets. Lines represent average aging trajectories from multilevel growth models reported in Table A.6. Y-axes are inverted for B, C & E for readability.
