
Figure 4. Behavioral and Physiological Responses to Social Separation Test.
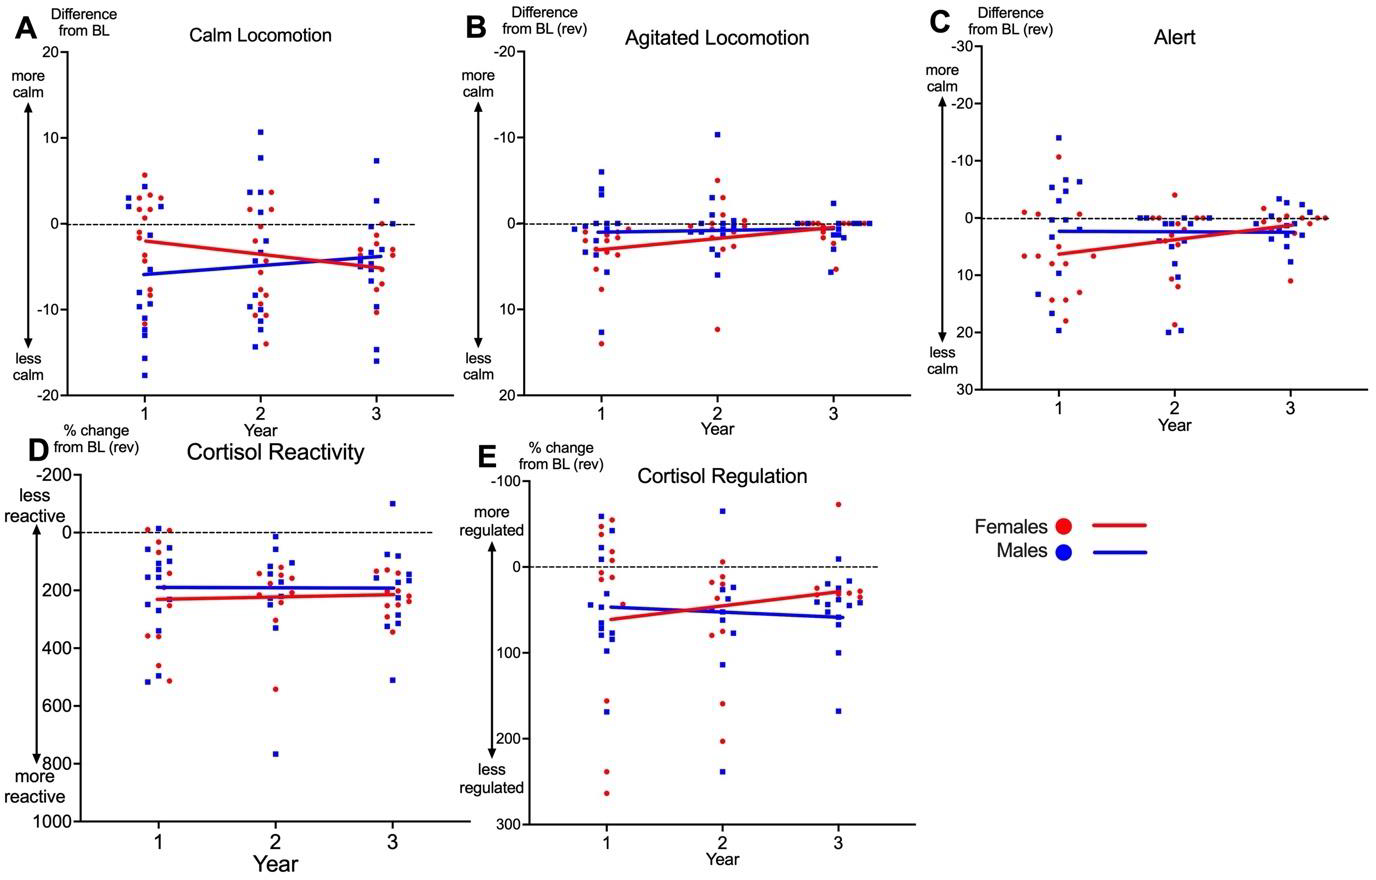
Aging trajectories for males (blue) and females (red) for measures of behavioral (A-C) and physiological (D-E) reactivity, calculated as difference between pre-separation baseline (BL) and total separation score. Positive values represent increase from BL during separation and negative values represent decrease from BL. Zero represents no change from BL, which is indicated with a dotted line. Points represent averages scores for individual marmosets within each year. Lines represent average aging trajectories from multilevel growth models reported in Table A.6. Y-axes are inverted for B, C, D & E for readability.