FIGURE 2.

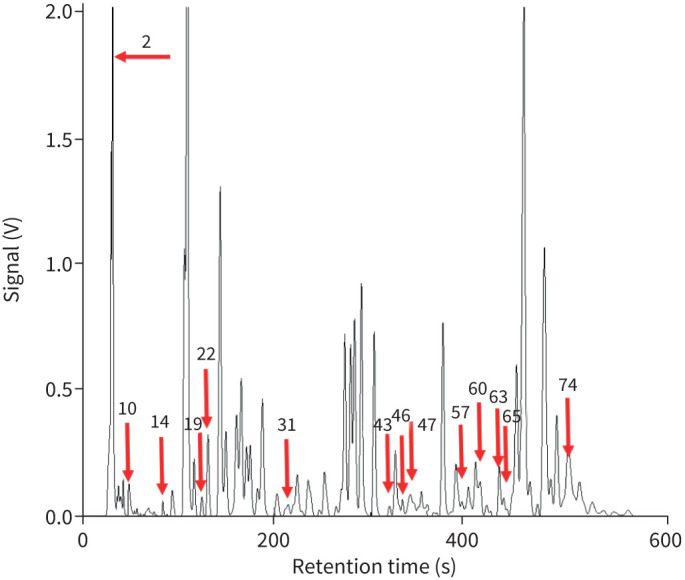
Representative gas chromatogram of exhaled breath from a swine animal via a ventilator. The red arrows show the locations of all peaks used in biomarker search (see details in table S1).

Representative gas chromatogram of exhaled breath from a swine animal via a ventilator. The red arrows show the locations of all peaks used in biomarker search (see details in table S1).