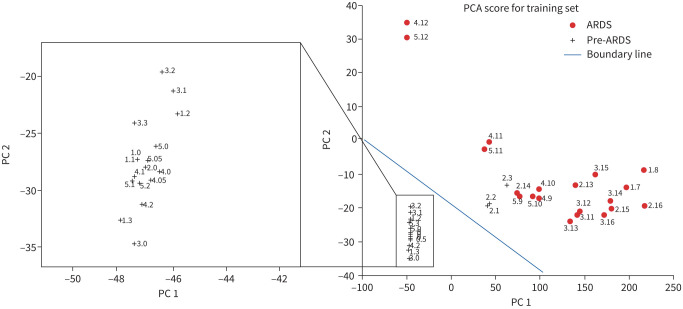
FIGURE 4.
Principal component analysis (PCA) plot for the training set (40 data points in total). Red circles and black crosses denote respectively acute respiratory distress syndrome (ARDS) and pre-ARDS, adjudicated using the Berlin criteria. The region below and above the boundary line represents the baseline and ARDS region, respectively, as determined by breath analysis using the seven biomarkers in table 1. The numbers shown in the PCA plot denote “swine number.sampling time”. For example: “1.2” refers to Swine #1 sampled 2 h after the induction of lung injury; “4.0” refers to Swine #4 sampled before the induction of lung injury; “4.11” refers to Swine #4 sampled 11 h after the induction of lung injury.

