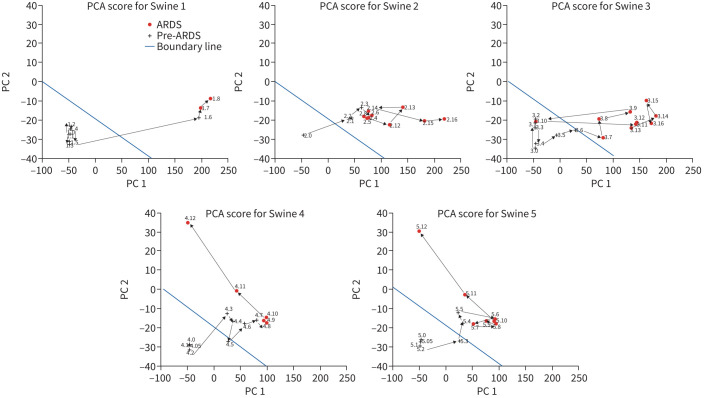
FIGURE 5.
Principal component analysis (PCA) plots showing hourly trajectories of individual swine starting from the 0th hour (healthy and just prior to the induction of lung injury) to the end of the experiment or until the animal died (last data point, acute respiratory distress syndrome (ARDS) confirmed by biopsy). This figure shows the dynamic change in a swine's breath when the animal status changes from healthy pre-ARDS to ARDS. Red circles and black crosses denote respectively ARDS and pre-ARDS, adjudicated based on the Berlin criteria.

