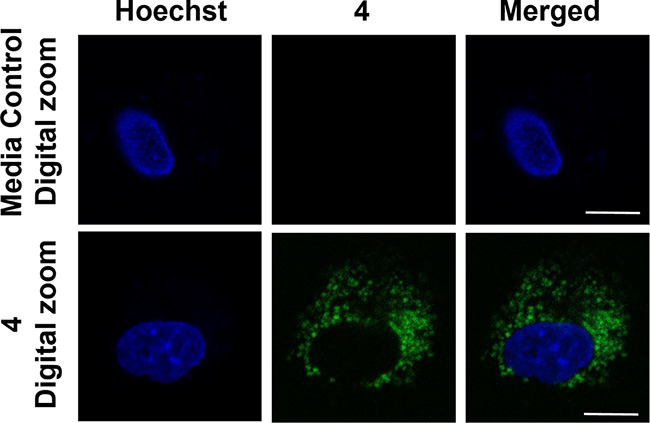
Figure 3.

Confocal microscopy images (63×) showing 4 in A549 cells. Row 1, media control. Row 2, cells treated with 4 (1 μM) for 1 h. Images depict the Hoechst nuclear stain (blue), compound 4 (green), and a merge of the two channels. Scale bar = 10 μm.
