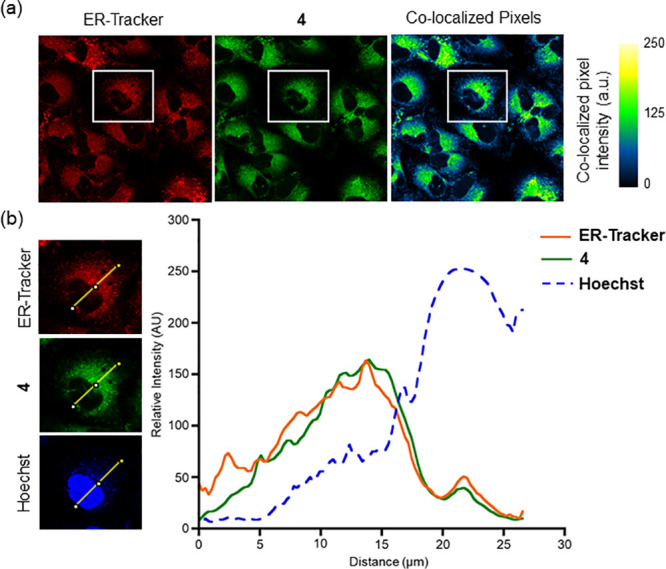
Figure 5.

Confocal images of A549 cells costained with 4, ER-Tracker Red, and Hoechst 33342. (a) Independent and colocalized pixels of 4 and ER-Tracker Red. (b) Overlaid intensity profile of regions of interest in the costained A549 cells as indicated by the white arrows.
