
FIGURE 3.
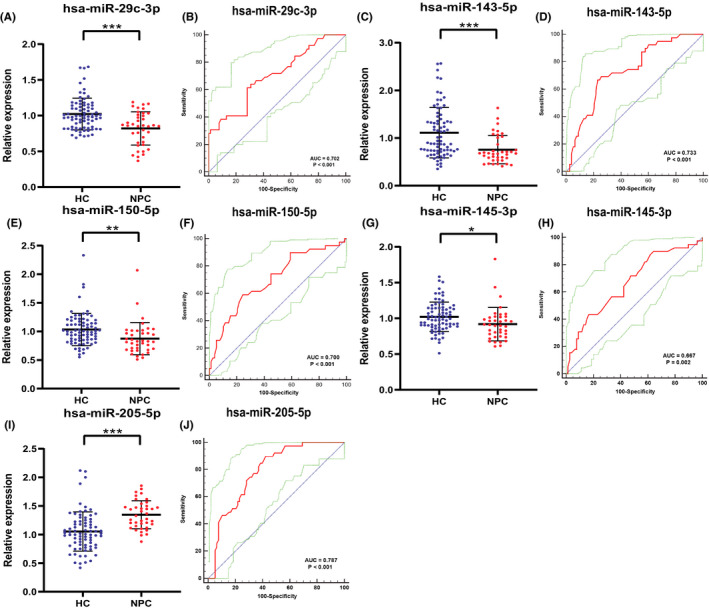
The relative expression of five miRNAs and the corresponding ROC curve in the verification stage. The sera of 39 NPC patients and 78 HCs patients were used for staging. The relative expression levels of (A) miR‐29c‐3p, (C) miR‐143‐5p, (E) miR‐150‐5p, and (G) miR‐145‐3p in the serum of NPC patients were significantly down‐regulated. (I) miR‐205‐5p is significantly up‐regulated. The area under the ROC curve is (B) miR‐29c‐3p with a 95% confidence interval of 0.611–0.783 is 0.702, (D) miR‐143‐5p with a 95% confidence interval of 0.644–0.811 is 0.733, (F) miR‐150‐5p with 95% confidence interval of 0.608–0.781 is 0.700, (H) miR‐145‐3p with 95% confidence interval of 0.574–0.752 is 0.667, and (J) miR‐205‐5p with 95% confidence interval of 0.701–0.857 is 0.787. * Represents p < 0.05, ** represents p < 0.01, *** represents p < 0.001. The red curve represents the receiver‐operating characteristic (ROC) curve. The green curve represents 95% ROC confidence interval. The blue line represents diagonal