
FIGURE 4.
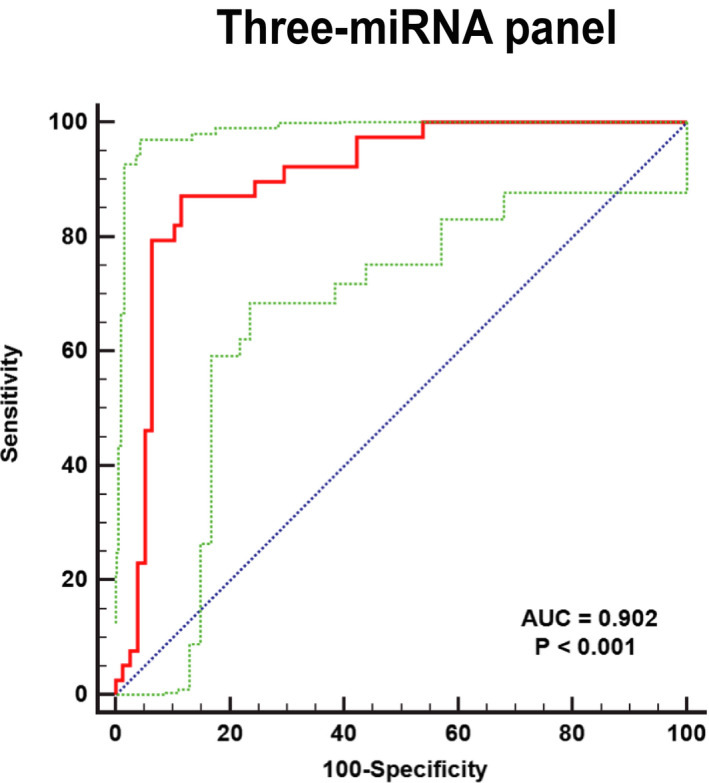
The receiver‐operating characteristic (ROC) curve analyses for the three‐miRNA panels. The AUC of the group consisting of three microribonucleic acids (miR‐29c‐3p, miR‐143‐5p, and miR‐205‐5p) is 0.903 (95% confidence interval: 0.833–0.949; sensitivity = 87.18%, specificity = 88.46%). The red curve represents the receiver‐operating characteristic (ROC) curve. The green curve represents 95% ROC confidence interval. The blue line represents diagonal