FIGURE 2.

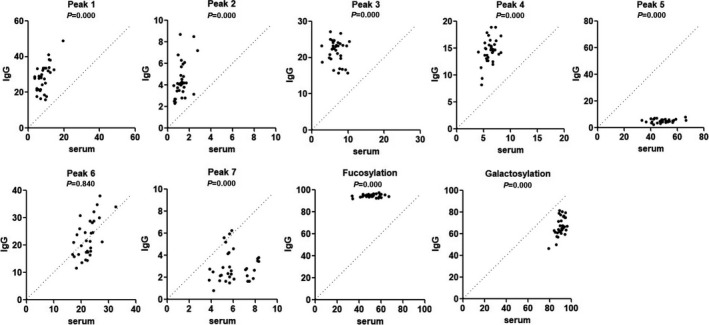
Comparisons of N‐glycan structure and glycosylation between serum and IgG in ITP patients (n = 34). The diagonal line represents the equal ratio between serum and IgG

Comparisons of N‐glycan structure and glycosylation between serum and IgG in ITP patients (n = 34). The diagonal line represents the equal ratio between serum and IgG