FIGURE 3.

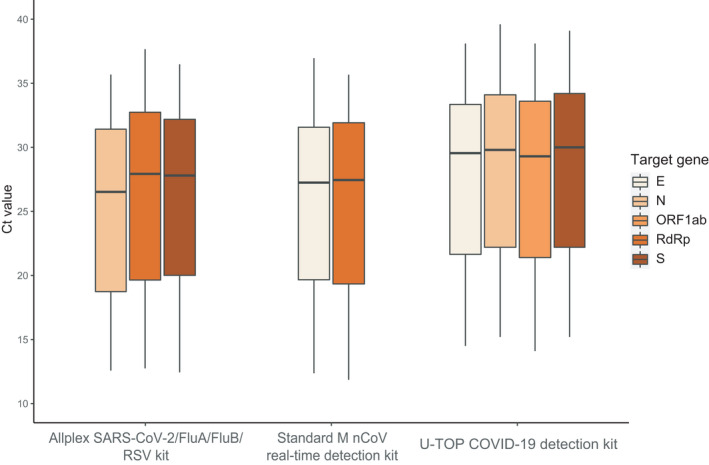
C t value of the distribution of target genes of three real‐time reverse‐transcription PCRs when analyzing the clinical samples

C t value of the distribution of target genes of three real‐time reverse‐transcription PCRs when analyzing the clinical samples