FIGURE 2.

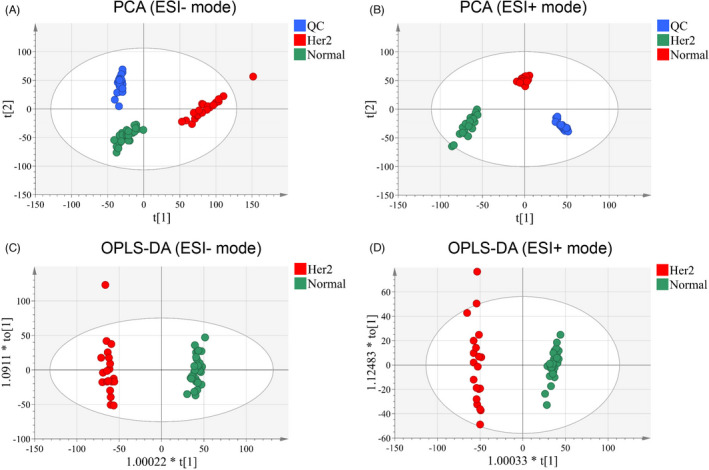
Multivariate statistical analysis results. PCA score plot of the analysis in ESI (−) mode (A) and ESI (+) mode (B). OPLS‐DA score plot of the analysis in ESI (−) mode (C) and ESI (+) mode (D)

Multivariate statistical analysis results. PCA score plot of the analysis in ESI (−) mode (A) and ESI (+) mode (B). OPLS‐DA score plot of the analysis in ESI (−) mode (C) and ESI (+) mode (D)