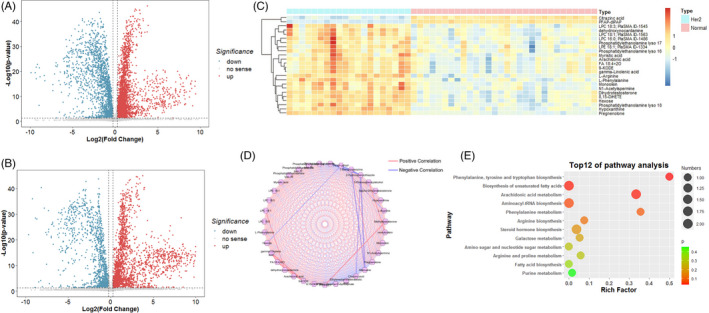
FIGURE 3.

Representative Volcano plot (fold change >1.5 and p value < 0.05) in ESI (+) mode (A) and ESI (+) mode (B) metabolomics data. (C) Representative heat map of significant different metabolites (fold change >1.5, VIP > 1 and p value < 0.05). (D) Metabolic network analysis. (E) Metabolic pathway analysis
