
FIGURE 4.
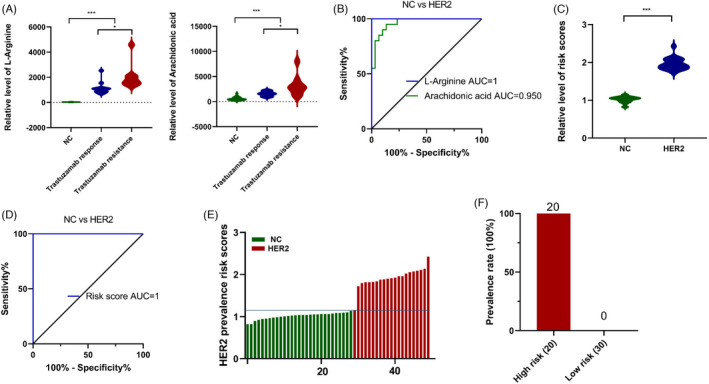
Development of risk score for HER2‐positive breast cancer using linear logistic regression models. (A) Statistical analysis of L‐arginine and arachidonic acid between normal control, trastuzumab responsive and resistant group. (B) ROC curves were created to evaluate the diagnostic power of L‐arginine and arachidonic acid. (C) Statistical analysis of risk score between HER2‐positive breast cancer and normal control. (D) ROC analysis of risk score for HER2‐positive breast cancer. (E) The distribution of risk score. (F) The prevalence of HER‐positive breast cancer in high‐risk group and low‐risk group. (*, p < 0.05; **, p < 0.01; ***, p < 0.001)