
FIGURE 5.
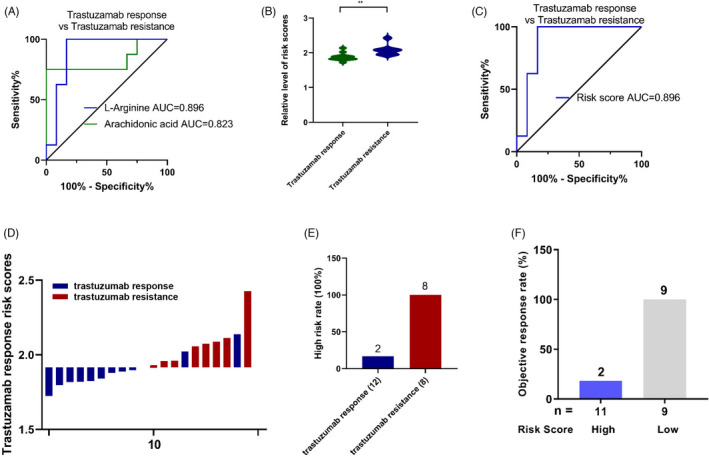
Development of risk score for trastuzumab resistance using linear logistic regression models. (A) ROC curves were created to evaluate the diagnostic power of L‐arginine and arachidonic acid for trastuzumab resistance. (B) Statistical analysis for distribution of risk score between trastuzumab responsive and resistant group (**, p < 0.01). (C) ROC analysis of risk score for trastuzumab resistance. (D) The distribution of risk score between trastuzumab responsive and resistant group. (E) High‐risk rate in trastuzumab responsive and resistant group. (F) Objective response rate in high and low‐risk group. (*, p < 0.05; **, p < 0.01; ***, p < 0.001)