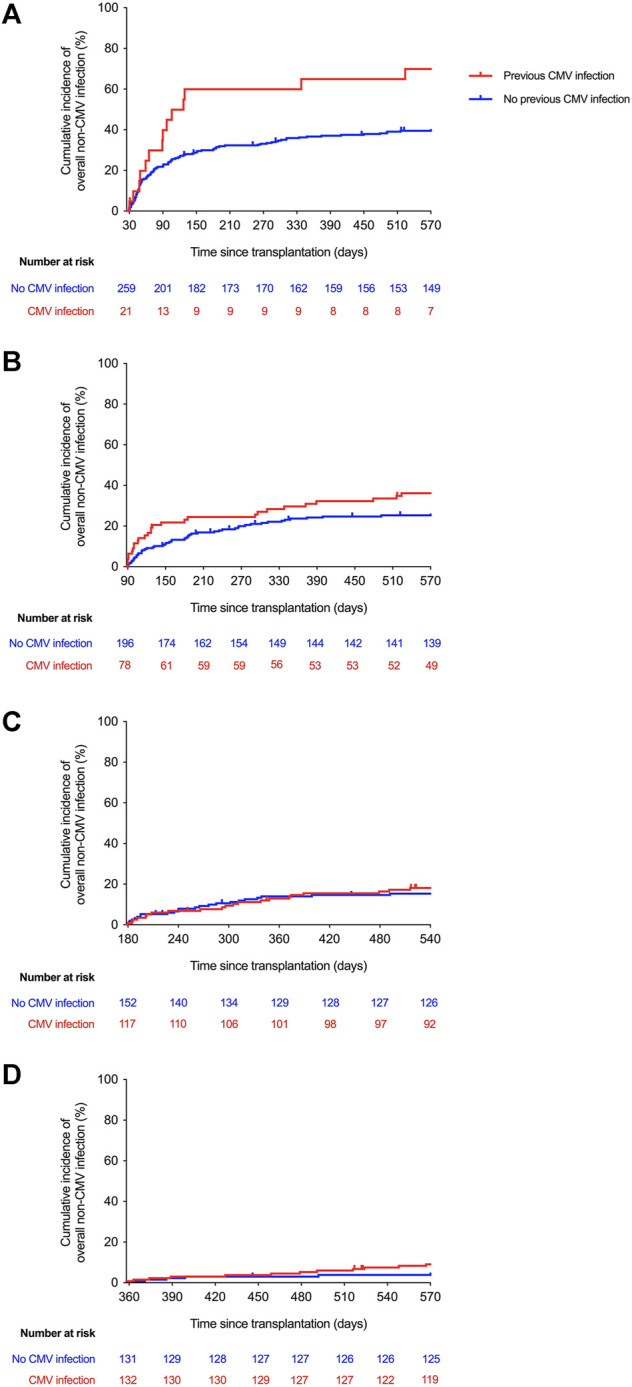
FIGURE 1.

Kaplan-Meier curves for the incidence of overall non-CMV infection according to the cumulative exposure to CMV infection at any level beyond day 30 (log-rank p-value = 0.002) (A), day 90 (log-rank p-value = 0.068) (B), day 180 (log-rank p-value = 0.727) (C), and day 360 (log-rank p-value = 0.314) (D) after transplantation. CMV: cytomegalovirus.
