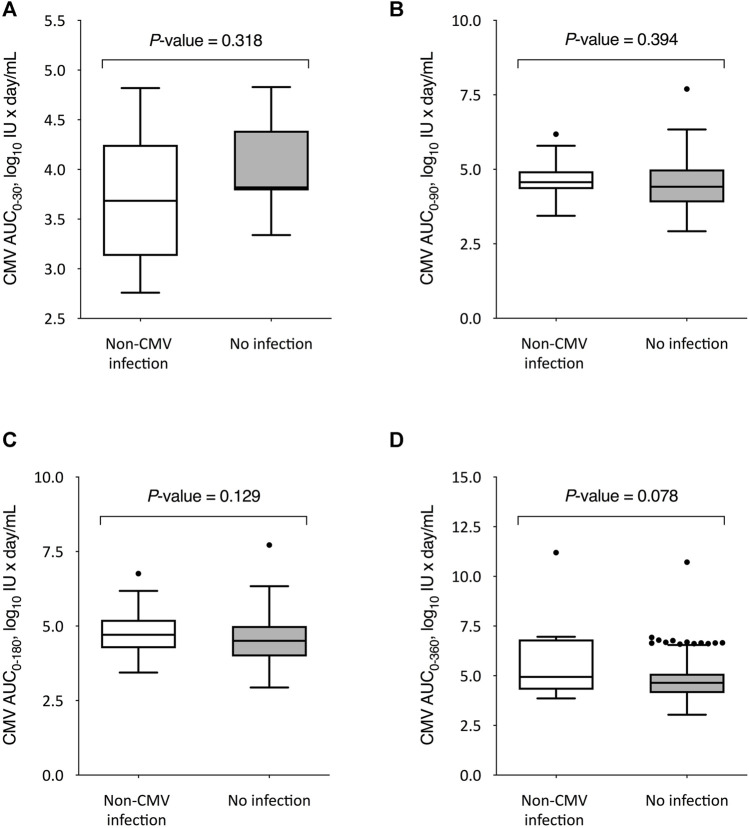
FIGURE 4.
Comparison of CMV-AUCs between KT recipients developing or not developing overall non-CMV infection beyond day 30 (A), day 90 (B), day 180 (C), and day 360 (D) after transplantation. Student’s t-test for unpaired data was used for all comparisons except for day 360, for which the U Mann-Whitney test was applied. The boxes present the interquartile distances, the horizontal lines the median, the whiskers the maximum and minimum values within 1.5 times the interquartile range, and the points the outliers. CMV-AUC: area under curve of cytomegalovirus viral load.

