FIGURE 1.
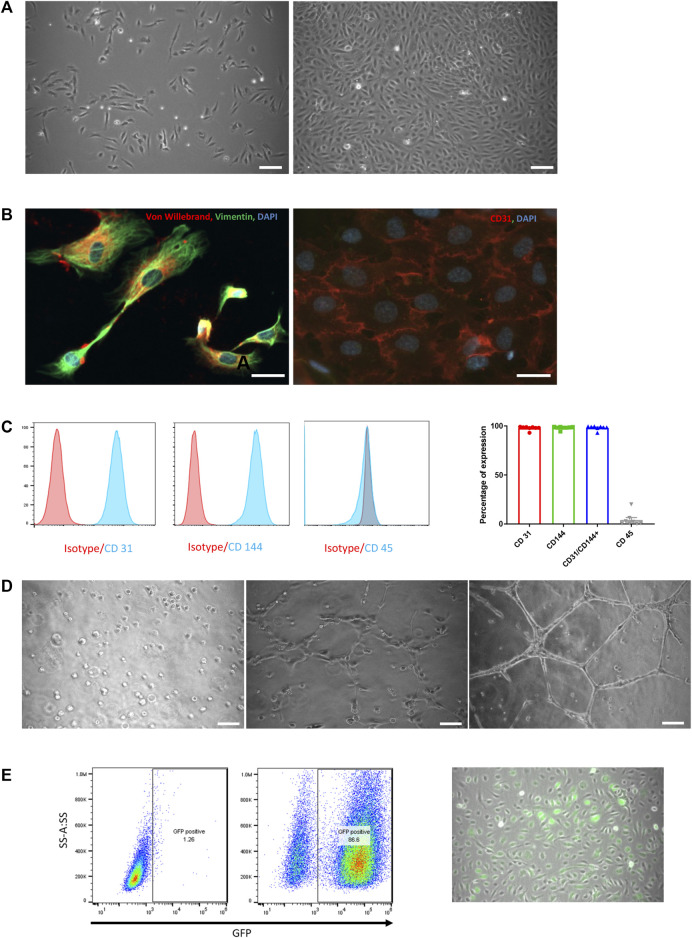
HUVEC characterization and in vitro functional assessment. (A) Phase-contrast microscopic pictures of HUVEC in culture at day 1 and day 5. Scale bar = 50 µm. (B) Immunofluorescence staining of cultured HUVEC with von Willebrand (red) and Vimentin (green, left panel) and CD31 (red, right panel). Nuclei are labelled with DAPI (blue). Scale bar = 25 µm. (C) FACS analysis on HUVEC for CD31, CD144 and CD45 with their respective isotypes (left panels) and expressed as the percentage of positivity of expression on 8 consecutive preparations (mean ± SEM, right panel). (D) Phase-contrast microscopic pictures of tube formation assessment on Matrigel at 0 h, 2 and 6 h. Scale bar = 50 µm. (E) Assessment of GFP transduction success by flow cytometry analysis (left panel) and by phase-contrast microscopic images (right panel). GFP-positive cells are spontaneously green, scale bar = 50 µm.

