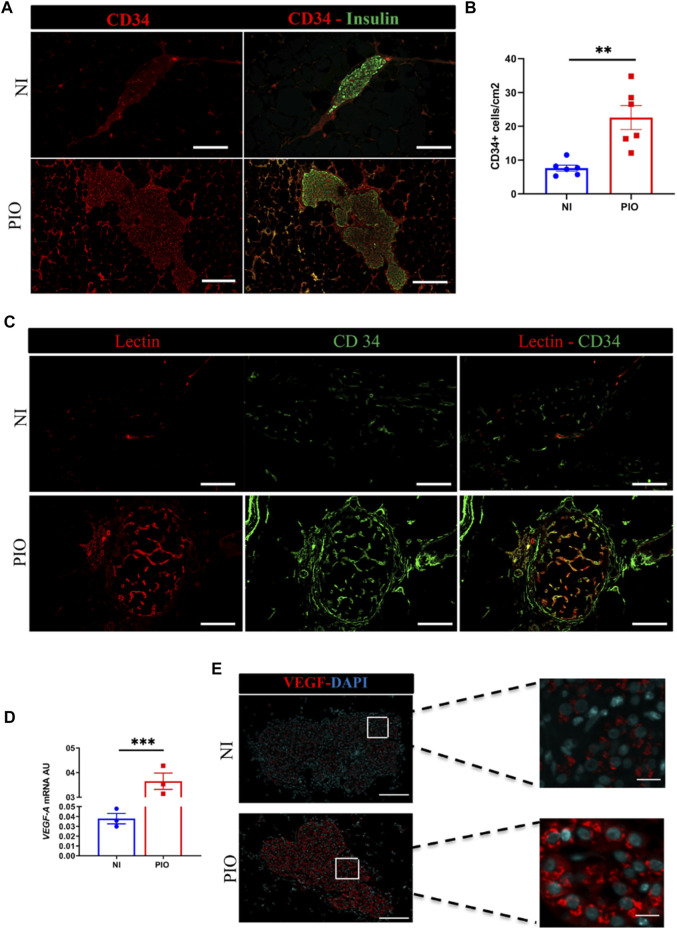
FIGURE 4.
In vivo revascularization assessment by immunohistological analysis. (A) The blood vessels of the graft detected at day 30 post-transplantation using CD34 (red) and insulin (green) immunostaining. Grafts Scale bar = 50 µm. (B) Quantitative analysis of revascularization was achieved by calculating the number of CD34 positive cells in the insulin positive area and the result was divided by the graft surface area. This was realized in two graft regions per mouse and in 3 mice per group. All data are expressed as mean ± SEM. *p < 0.05, **p < 0.01, comparisons were made by a 2-tail unpaired Student t test. (C) Assessment of vessel functional capacity by mice injection of 100 µl of lectin. Capillaries are labelled in red and endothelial CD34+ cells in green. Scale bar = 50 µm. (D) vegf-a mRNA expression analyzed by qPCR at 30-days post-transplantation in PIO and NI groups; data presented as arbitrary units (AU) after normalization to housekeeping genes. Data shown are expressed as mean ± SEM. ***p < 0.0006, 2-tail unpaired Student t test, n = 3. (E) Recovered grafts stained for VEGF-A at day 30 after transplantation. Scale bars = 100 μm.

