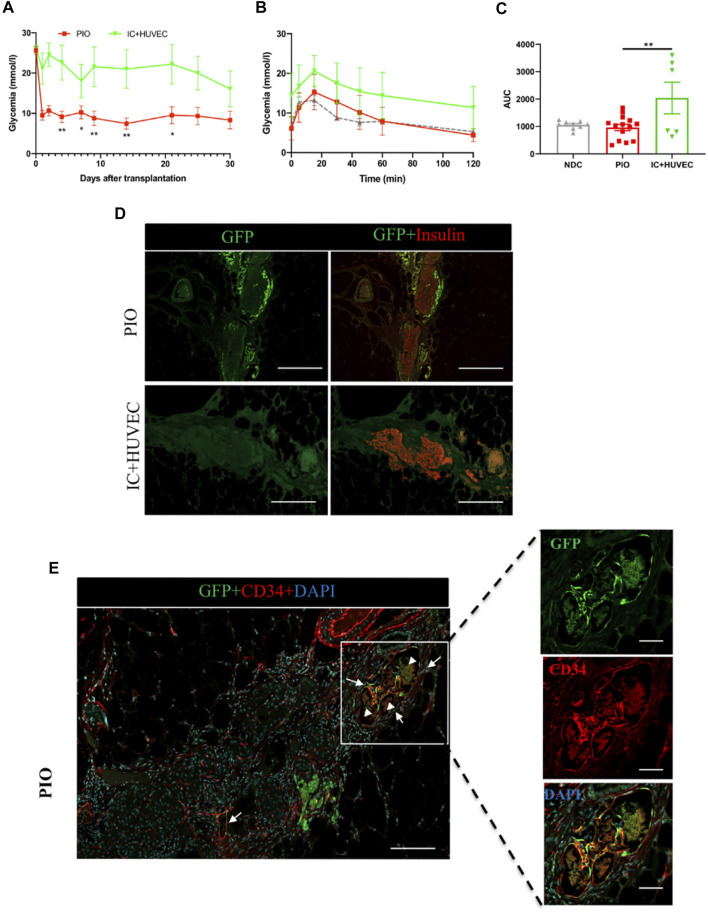
FIGURE 5.
In vivo function of IC + HUVEC spheroids, in immunodeficient, diabetic mice. (A) Mean glucose levels measured in NOD‐Rag1 null mice transplanted with PIO (n = 14, red squares) and IC + HUVEC (n = 6, green inverted triangles). Mean glucose level was compared at 4, 7, 9, 14, 21 and 30 days post-transplantation by a 2-tail unpaired Student t test. All data are expressed as mean ± SEM. *p < 0.05, **p < 0.01. (B,C) Intraperitoneal glucose tolerance test performed at 30 days post-transplantation and their corresponding AUC. Grey triangle represents the non-diabetic control (NDC) group (n = 9). Comparisons were made by a one-way ANOVA with Dunnett’s multiple comparison test. All data are expressed as mean ± SEM. *p < 0.05, **p < 0.01. (D) Graft-bearing EFP recovered at 30 days post-transplantation and stained for GFP (green) and insulin (red). Scale bar = 100 µm. (E) Immunohistological staining for GFP (green), CD34 (red) and DAPI (blue). The yellow color represents the GFP-HUVECs with positive staining of anti-CD34. Arrows indicate chimeric blood vessels. Arrowheads indicate red blood cells. Scale bar for top panel = 100 µm and for the 3 bottom panels, 20 µm.

