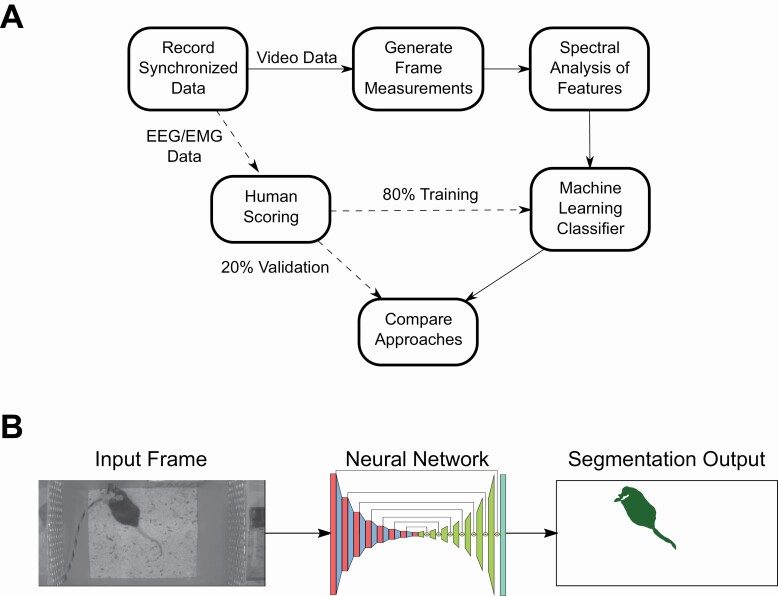
Figure 1.
Visual data flow of our experimental pipeline.
(A) A visual description of how we organized data collection, annotation, feature generation, and classifier training. (B) A visual description of frame-level information we use for visual features. We used a trained neural network to produce a segmentation mask of pixels pertaining to the mouse for use in downstream classification.

