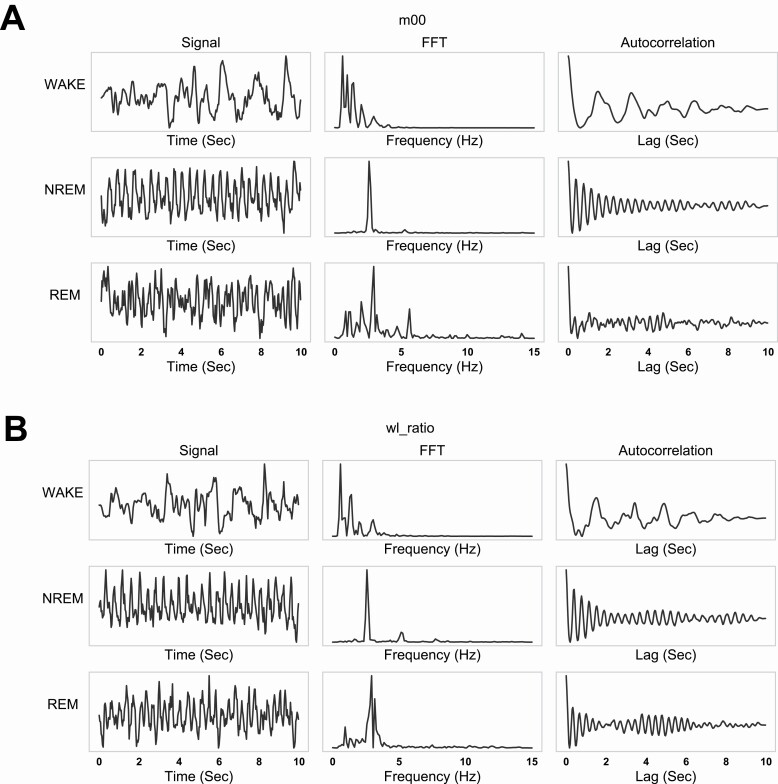
Figure 2.
Examples of selected signals in time and frequency domain within one epoch.
(A) the leftmost column shows m00 (area of the segmentation mask) for the wake, NREM, REM states; the middle column gives the FFT of the corresonding signals;the rightmost column shows the auto-correlation of the signals. (B) wl_ratio in time and frequency domain, similar to panel (A).

