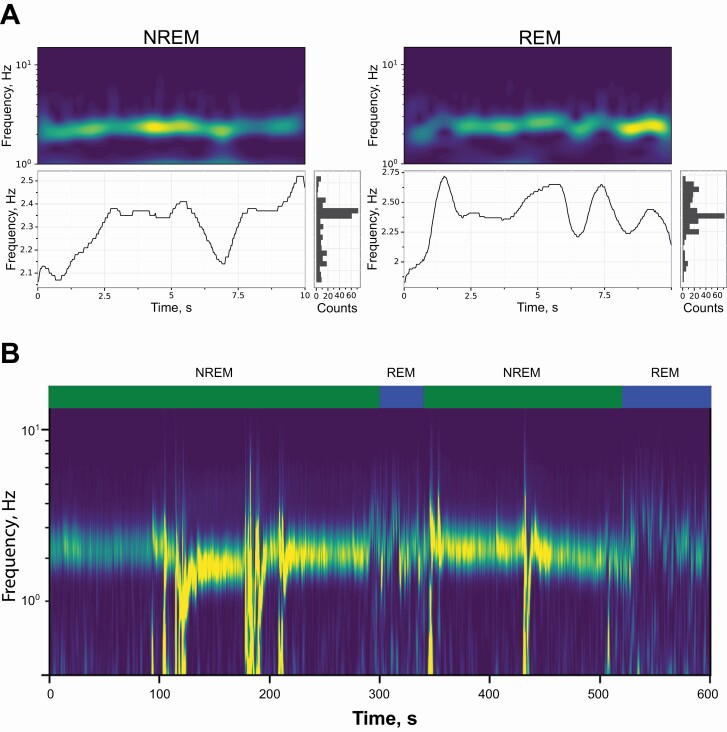
Figure 3.
Breathing singal extraction from video.
(A) Exemplar spectral analysis plots for REM and NREM epochs. The continuous wavelet transform spectral response (top) and associated dominant signal (bottomleft), and a histogram of the dominant signal (bottom right). NREM epochs typically show a lower mean and standard deviation than REM epochs. (B) Inspecting a larger time scale of epochs shows that the NREM signal is stable until a bout of REM. Dominant frequencies are typical mouse breathing rate frequencies.

