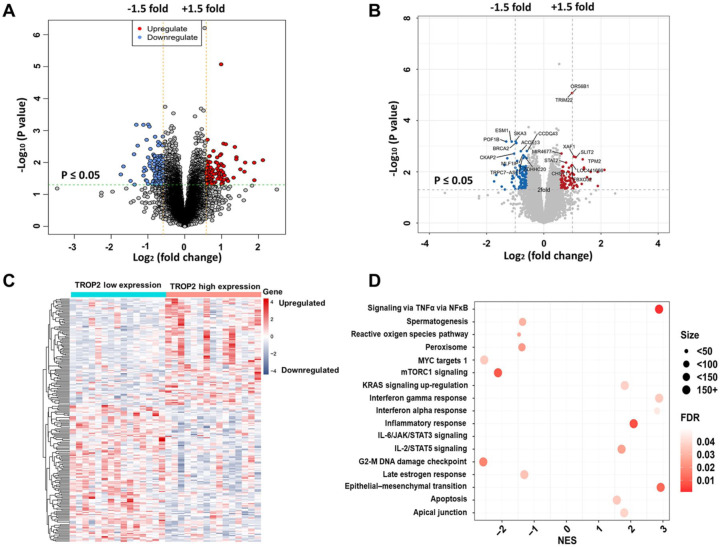
Figure 4.
Genome-wide gene expression profile and signaling pathways associated with trophoblast antigen protein 2 (TROP2) expression. (A) Volcano plot of the upregulated and downregulated genes associated with differential TROP2 expression. Significantly regulated genes associated with high TROP2 expression and low TROP2 expression are marked by red and blue circles, respectively. (B) Volcano plot of some of the significantly upregulated and downregulated genes. (C) Expression heatmap of TROP2 expression. (D) Gene set enrichment analysis (GSEA) of the cell signaling pathways related to TROP2 expression.
FDR, false discovery rate; NES, normalized enrichment score.

