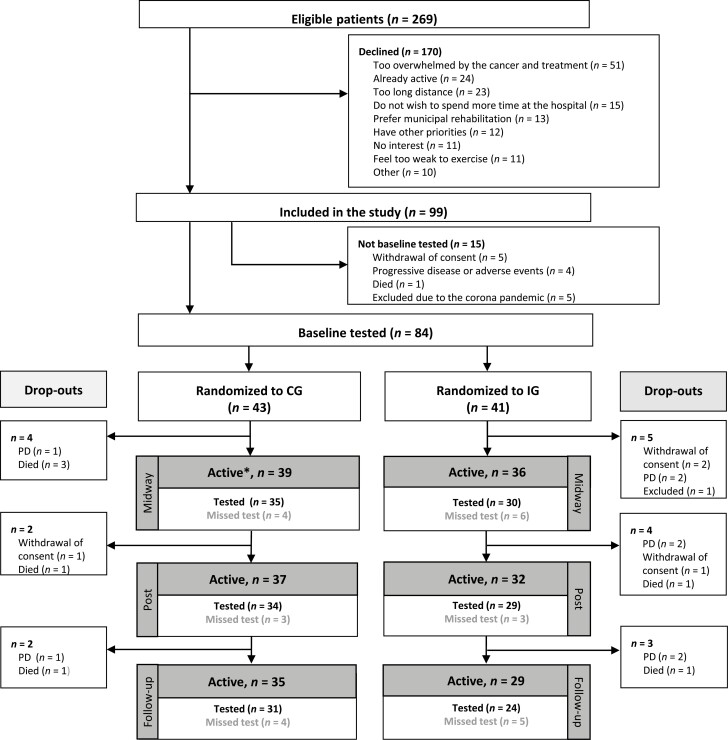
Figure 1.
Study flow. Flow diagram showing the number of included participants, randomization, completed tests, and drop-outs. ∗, Active: number of participants that were still included in the study at the time of each assessment and thus should have been tested. Abbreviations: CG, control group; IG, intervention group; PD, progressive disease.

