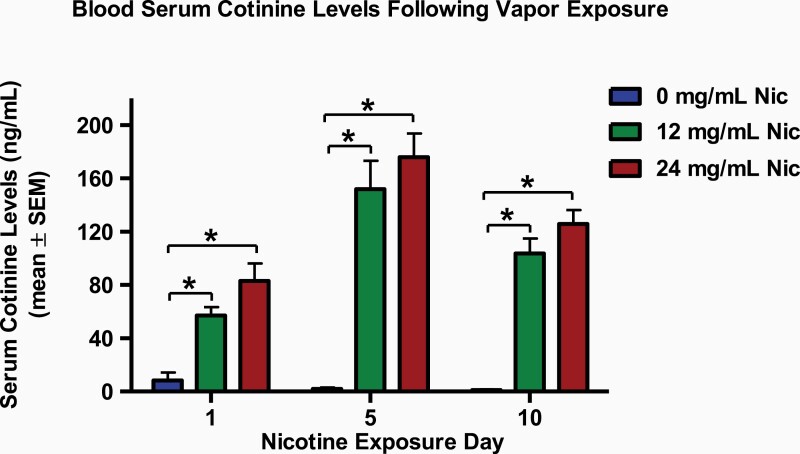
Figure 1.
Blood serum cotinine levels of rats exposed to nicotine or vehicle vapors on exposure days 1, 5, and 10. The rats that were exposed to the 12 mg/mL nicotine vapor (12 mg/mL Nic, green bars) and 24 mg/mL nicotine vapor (24 mg/mL Nic, red bars) displayed an increase in serum cotinine levels when compared with the control rats that were exposed to 0 mg/mL nicotine vapor (0 mg/mL Nic, blue bars). No significant differences were observed between the 12 and 24 mg/mL nicotine treatment groups. Data are presented as mean ± SEM. Asterisk (*) indicates a significant difference between the 0 and 12 or 24 mg/mL nicotine vapor treatment groups. Critical p value is .05.

