Figure 2.

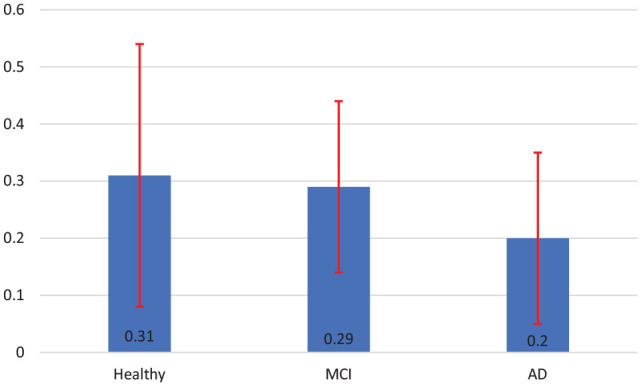
Difference in the normalized correct trajectory from baseline to post-intervention, testing trials of the Morris water test (mean ± SE), Healthy participants (n = 2), MCI participants (n = 4) and Alzheimer’s participants (n = 4).

Difference in the normalized correct trajectory from baseline to post-intervention, testing trials of the Morris water test (mean ± SE), Healthy participants (n = 2), MCI participants (n = 4) and Alzheimer’s participants (n = 4).