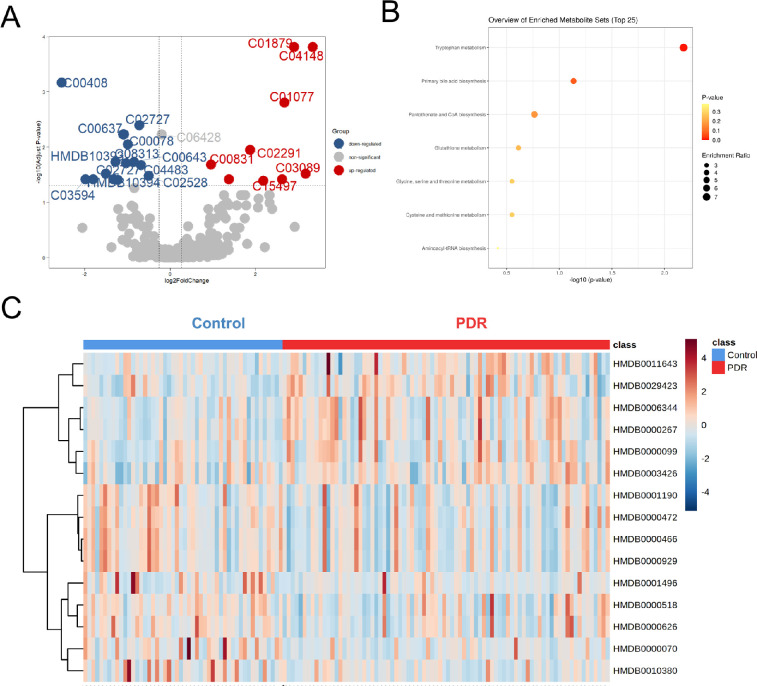
Figure 3.
Differential metabolites and metabolic pathways from plasma. (A) Volcano plot showing differential metabolites between groups. Upregulated and downregulated metabolites are in red and blue, respectively. Nonsignificant metabolites are represented by gray dots. (B) Metabolite set enrichment analysis showed that seven differential pathways differed between the PDR and control groups. (C) Heatmap showing relative peak areas of dysregulated metabolites in plasma.

