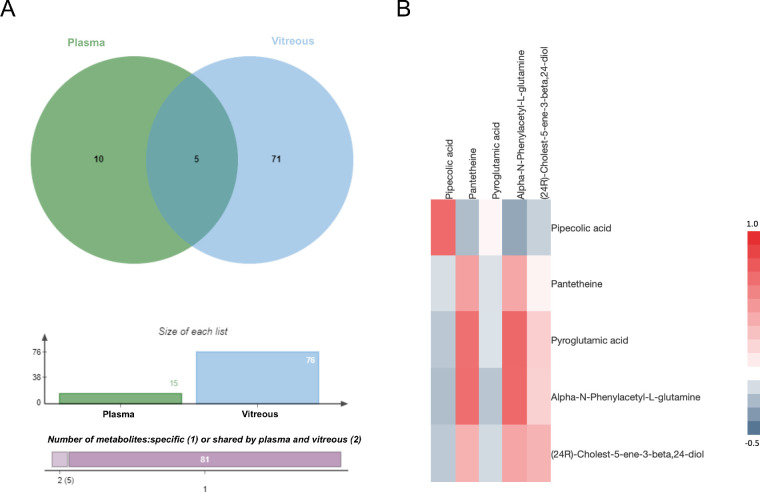
Figure 6.
Relationship between vitreous metabolites and plasma metabolites. (A) Venn diagram analysis shows there were five overlapping metabolites between plasma and vitreous. (B) Based on the relative abundance of all overlapping metabolites, the heatmap was generated showing the matrix of the Pearson correlation coefficient.

