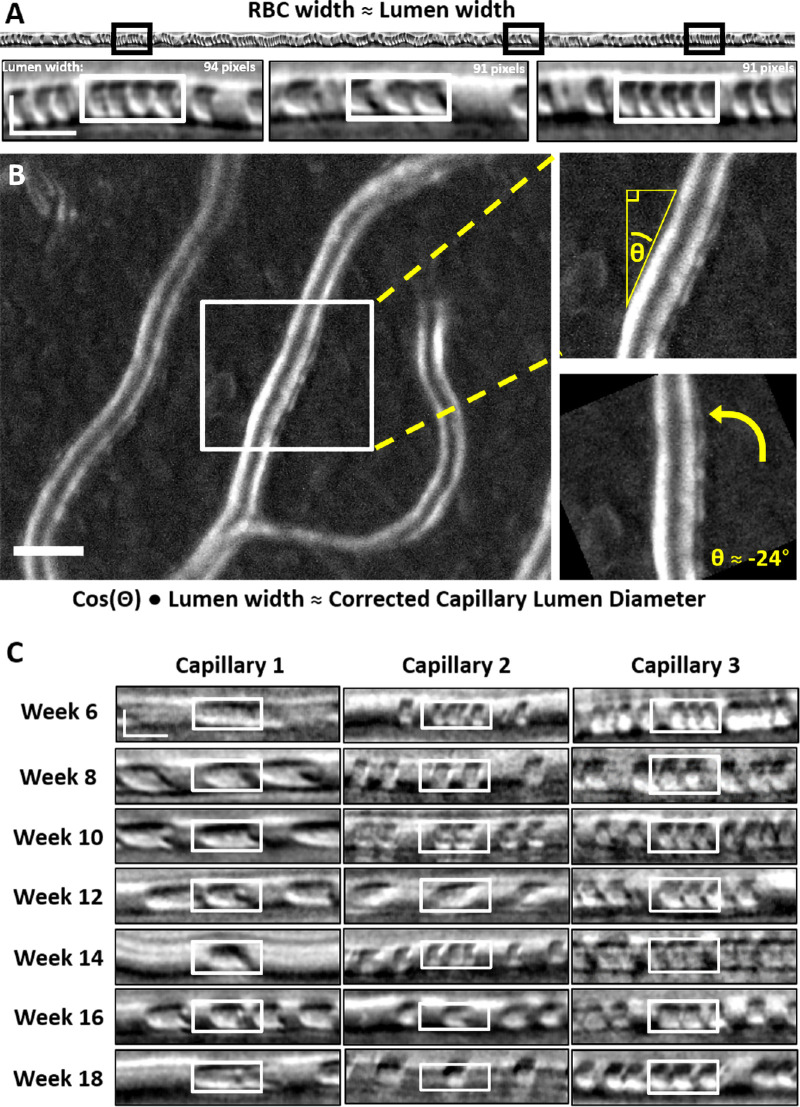
Figure 3.
Manual measurement of capillary lumen diameter. (A) Black boxes denote sample measurement locations from 1-second space-time images. White boxes show sample RBC width measures (in space, vertical axis). Vertical scale bar, 4 µm; horizontal scale bar:, 10 ms. (B) Sample motion contrast image (2.39° × 1.94° FOV; left) used for manual capillary angle determination. Scale bar, 10 µm. The white box represents the crop location for angle determination depicted at right. (C) Sample RBC width measurements (white boxes) over the study duration for three capillaries, each from a different mouse. Scalebar is same as in (A).

