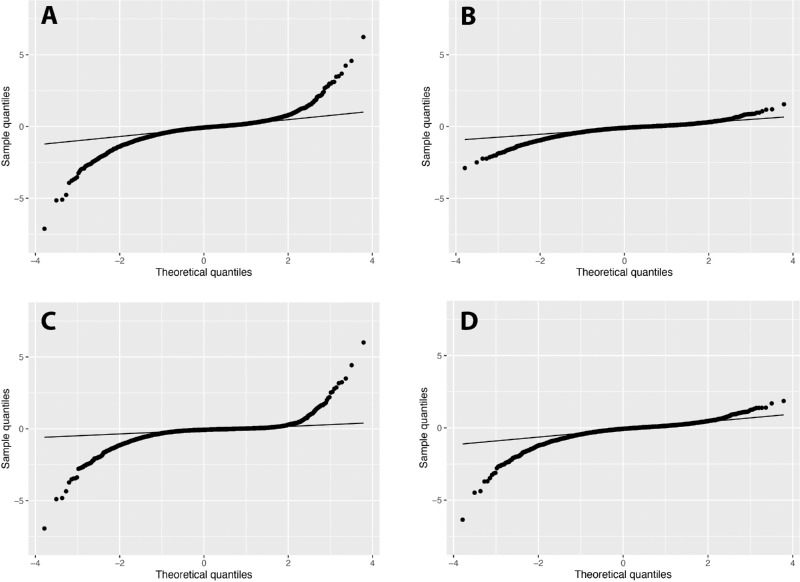
Figure 1.
Quantile–quantile plots describing the distributions of the estimated slopes from (A) OLS regression and posterior estimated slopes from the (B) Gaussian, (C) Student's t, and (D) log-gamma Bayesian linear mixed models. Deviations from the line indicate that the distributions are non-normal. OLS and Student's t models demonstrated a wider range of slopes with more positive and negative extreme values, whereas the Gaussian model demonstrated a more normal distribution of slopes with shrinkage to the mean. The log-gamma model demonstrated more extreme negative values, indicating a left-skewed distribution.

