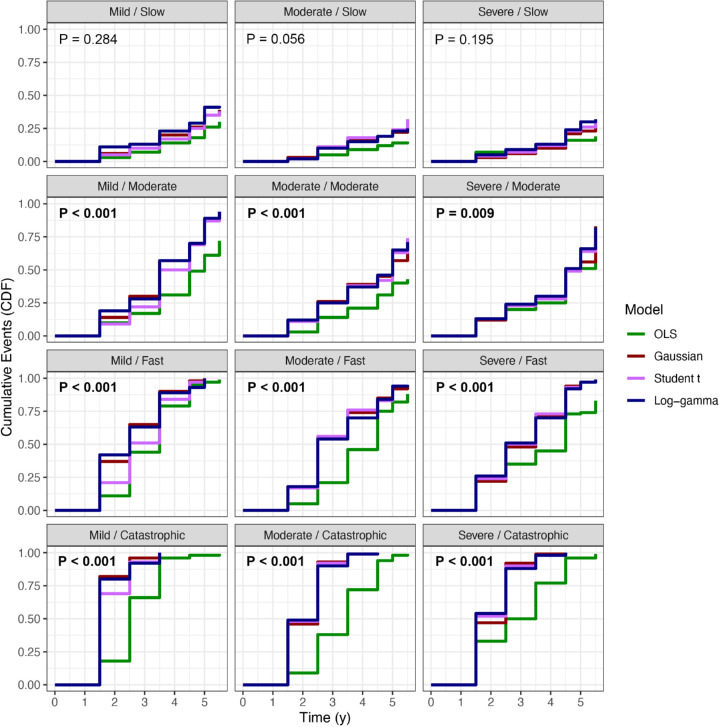
Figure 4.
Cumulative event curves demonstrating cumulative probability of declaring glaucomatous progression in various simulation settings. The first term of each setting refers to the baseline disease severity, and the second refers to the rate of change. The curves of the three Bayesian linear mixed models and OLS regression were compared with the log-rank test, and the respective P values are presented for each setting. Of note, the third visual field occurred at 1.5 years and the fifth visual field occurred at 3.5 years in these simulations.

