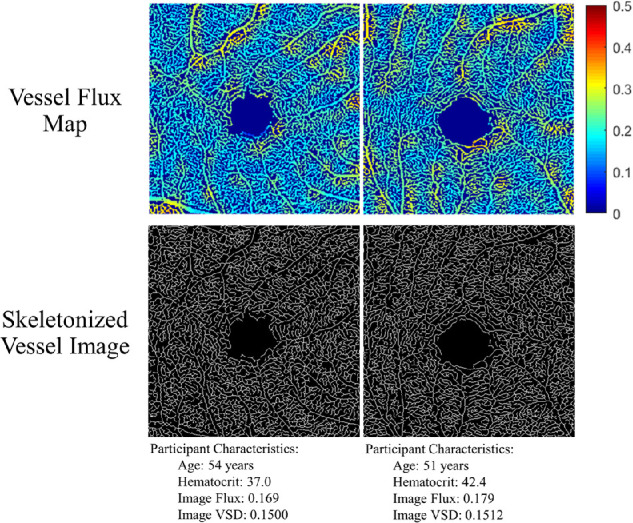
Figure 1.

Vessel flux and skeletal vessel map from the right eyes of two female participants with OCTA image signal strength of 10 and hematocrit values spanning the normative range from the cohort of subjects in this study. Note that the subject with the higher hematocrit value demonstrates a relatively higher flux value than skeleton density value.
