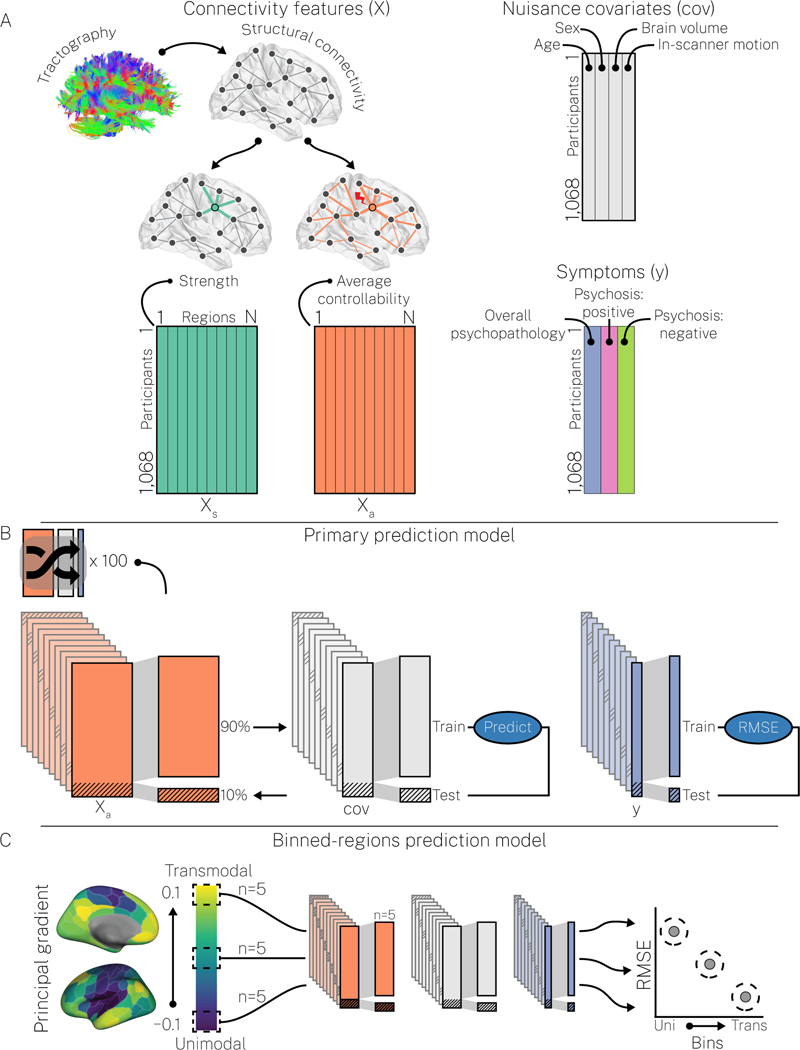
Figure 1. Machine learning prediction models.
A, We combined regional structural connectivity features (e.g., strength, Xs; average controllability, Xa), nuisance covariates (cov; age, sex, total brain volume, and in-scanner motion), and symptom dimensions (y; overall psychopathology, positive psychosis spectrum symptoms, and negative psychosis spectrum symptoms) into two main prediction models. Note, we ran each combination of X and y separately. B, In our primary prediction model, X was used to predict y, controlling for age, sex, brain volume, and in-scanner motion, via 100 repeats of 10-fold cross-validation, each repeat using a different random split of the data. This model provided robust estimates of prediction performance that could be compared across combinations of X and y. This primary prediction model was supplemented with a secondary prediction model that incorporated hyper-parameter optimization (see Figure S1 and the Supplementary Materials for details) and a null prediction model that assessed whether specific combinations of X and y yielded above-chance prediction performance (see Figure S2 and the Supplementary Materials for details). C, In our binned-regions prediction model, X was used to predict y, controlling for age, sex, brain volume, and in-scanner motion, using non-overlapping subsets of 5 regions sampled from the principal cortical gradient of functional connectivity. The principal cortical gradient (left) was generated in our data using resting-state functional connectivity (see Supplementary Materials for details). This model enabled examination of how prediction performance varied over the putative cortical hierarchy.

