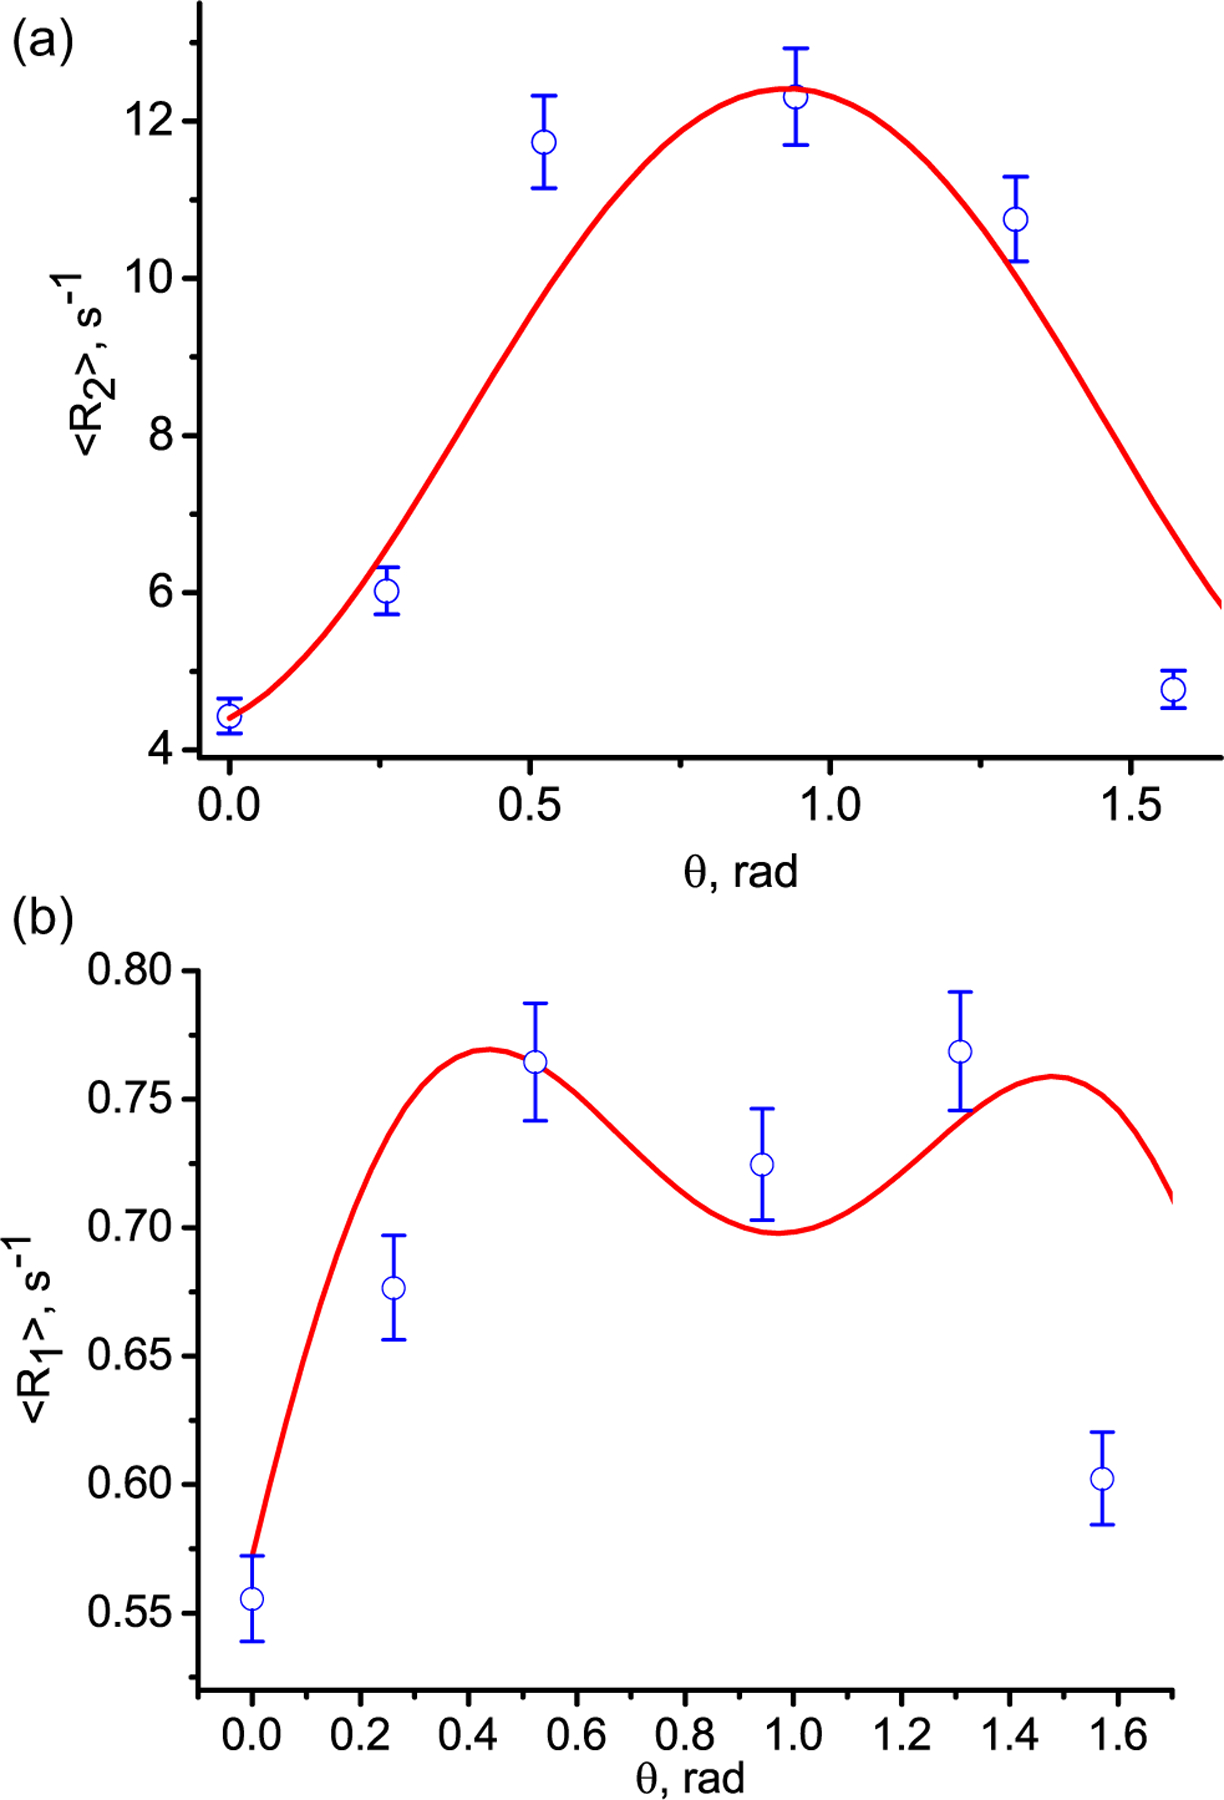
Fig. 4.

Angular dependence of the transverse 〈R2(θ)〉 (a) and tlongitudinal 〈R1(θ)〉 (b) relaxation rates in the celery stem. The blue circles are the experimental rate 〈R2(θ)〉 measured with the CPMG pulse sequence and 〈R1(θ)〉 measured with inversion recovery pulse sequence. The solid red curves are according to Eq. (12) for the standard deviations of 0.33 and 0.1 for the polar and azimuthal angles, respectively, for both relaxation rates.
