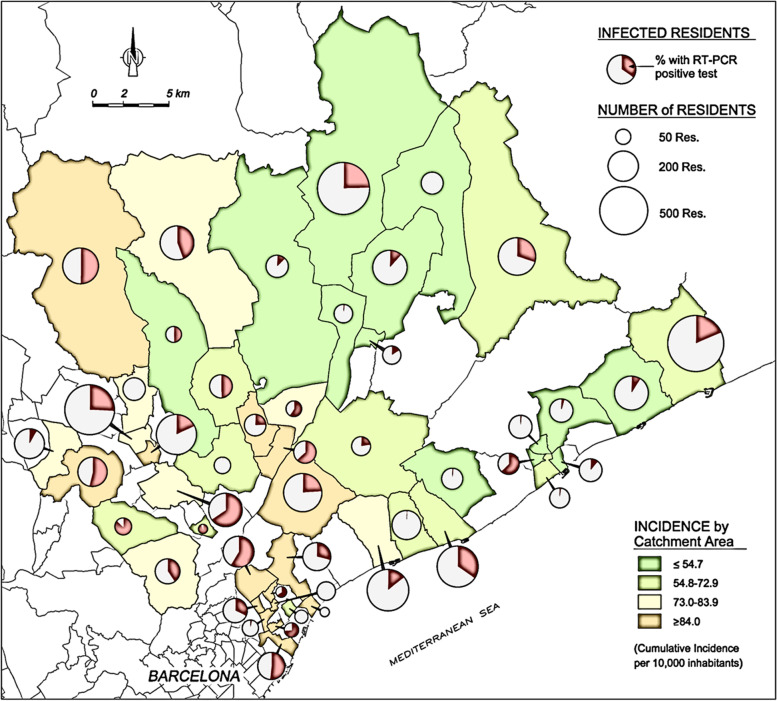
Fig. 2.
Cumulative incidence of SARS-CoV-2 infection of LTCLTCF residents and corresponding catchment area. The testing coverage was similar between different catchment areas during the study period and was mainly focused on symptomatic cases and contacts of positive cases. The incidence shown here is therefore an underestimation of the true incidence but should be considered proportional to it and an acceptable proxy. The size of the pie charts are correlated to the number of LTCF residents registered in each catchment area, not to the size of the LTCF’s

