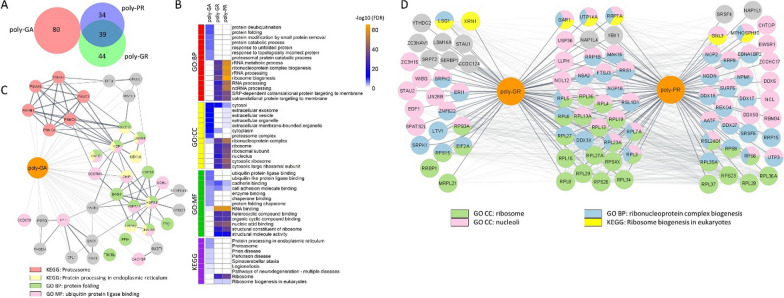
Fig. 2.
The poly-GA associated proteome is distinct from those for poly-GR and -PR. A Venn Diagram showing the overlap between the identified associated proteins for poly-GA, poly-GR and poly-PR dipeptide repeats; B Heatmap of the most enriched GO and KEGG terms in DPR-associated protein sets. Cell colors represent − log10 of the adjusted p-value of enrichment; C STRING interaction network for a subset of the identified poly-GA associated proteins that belong to the indicated GO or KEGG terms or directly interact with proteins belonging to these terms. Node colors indicate protein affiliation with the indicated terms. Solid edges represent the interactions from the STRING database, transparent edges illustrate the association between poly-GA and proteins shown here. Edge thickness corresponds to the STRING combined score of an interaction. D STRING interaction network for a subset of the identified poly-GR and poly-PR associated proteins that belong to the indicated GO or KEGG terms or directly interact with proteins belonging to these terms. Node colors indicate protein affiliation with the indicated terms. Transparent edges represent the interactions from the STRING database, solid edges illustrate the association between poly-GR or poly-PR and proteins shown here

