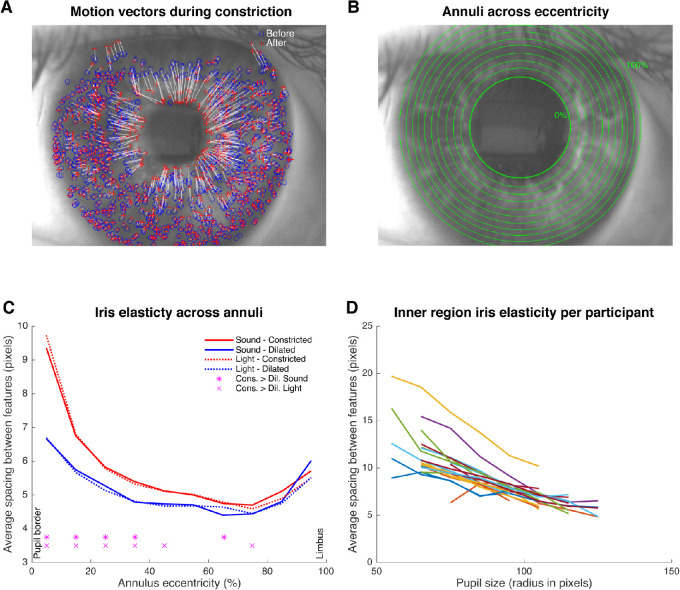
Figure 3.
Irissometry results. (A) Example snapshot from a video in which the pupil is in a state after constriction in response to the onset of a light stimulus. We detected unique features in the iris, here displaying their locations before (blue circles) and after (red plus signs) pupil constriction, with the white lines representing their motion vectors. Note that the pupil border before constriction laid somewhere near the innermost blue circles. (B) Each adjacent pair of circles represents a binned annulus region in which the spacing between features within that region is calculated. These regions correspond to the bins used for the plot in panel (C). The radius and width of the annuli move adaptively with changing pupil size to ensure an equal and consistent number of iris features across annuli and pupil sizes, respectively. The image displays the dilated pupil state preceding the constricted pupil state shown in panel (A). (C) Pattern of feature- and participant-averaged spacing between features falling within the annuli across eccentricities, per stimulus type and per constricted (red) versus dilated (blue) pupil state (split analysis). Asterisks and crosses at the bottom of the panel indicate at which iris eccentricities spacing significantly differed between pupil size states caused by sounds and lights, respectively (P < 0.001). (D) Lines show the average spacing within the innermost iris region (eccentricity = 5%) across binned pupil size per participant (one color per participant).

