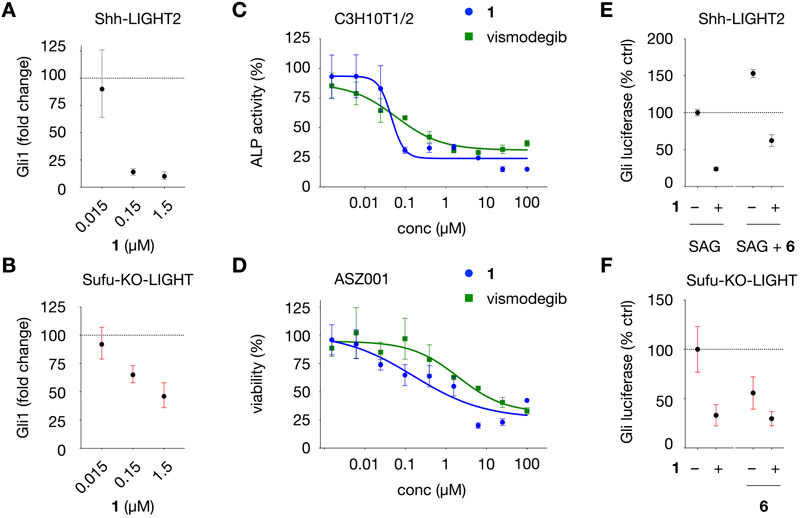
Figure 4.
Characterization of Gli inhibition in diverse cell types and on Gli-driven luciferase activity in the presence of a MEK inhibitor. (A) Gli1 mRNA levels in Shh-LIGHT2 cells treated with 200 nM SAG and 1 at the concentrations indicated for 30 h. (B) Gli1 mRNA levels in Sufu-KO-LIGHT cells treated with 1 at the concentrations indicated for 30 h. In panels A and B, fold change is calculated relative to levels of B2M RNA using the ΔΔCt method. (C) Dose–response curves for 1 and vismodegib in C3H10T1/2 cells. Alkaline phosphatase activity (ALP) is calculated relative to Gli-driven ALP activity induced by 200 nM SAG (100%). (D) Dose–response curves for growth inhibition by 1 and vismodegib in ASZ001 mBCC cells treated at the concentrations indicated for 48 h, measured using the CellTiter assay. Viability is calculated relative to DMSO (100%). (E) Relative Gli-driven luciferase inhibition in Shh-LIGHT2 cells by 1 (1.5 μM) in the presence of SAG (200 nM) and MEK inhibitor CI-1040 (6, 100 nM). (F) Relative Gli-driven luciferase inhibition in Sufu-KO-LIGHT cells by 1 (1.5 μM) in the presence of MEK inhibitor 6 (100 nM). For panels E and F, Gli luciferase is calculated relative to Gli-driven luciferase activity induced by 200 nM SAG in Shh-LIGHT2 cells (100%) or DMSO in Sufu-KO-LIGHT cells (100%). All values are the mean of n > 3 biological replicates ± SD.

