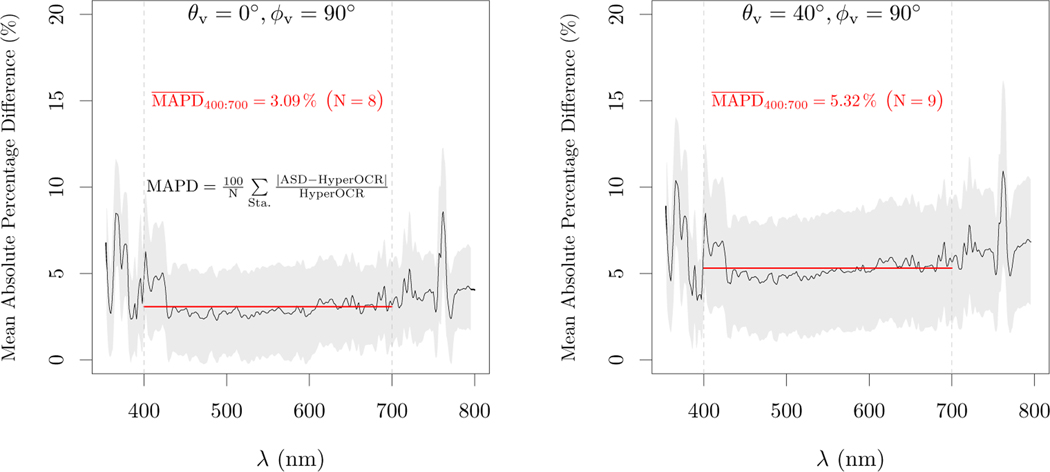
Fig. 8:
Results of the field inter-comparison showing the spectral mean absolute percentage difference of Eg between irradiance sensors and the plaque method for each geometry, with a grey PTFE and using Eq. 7. Grey area represents the standard deviation of the absolute percentage difference. The average over the visible range is represented by a red line.

