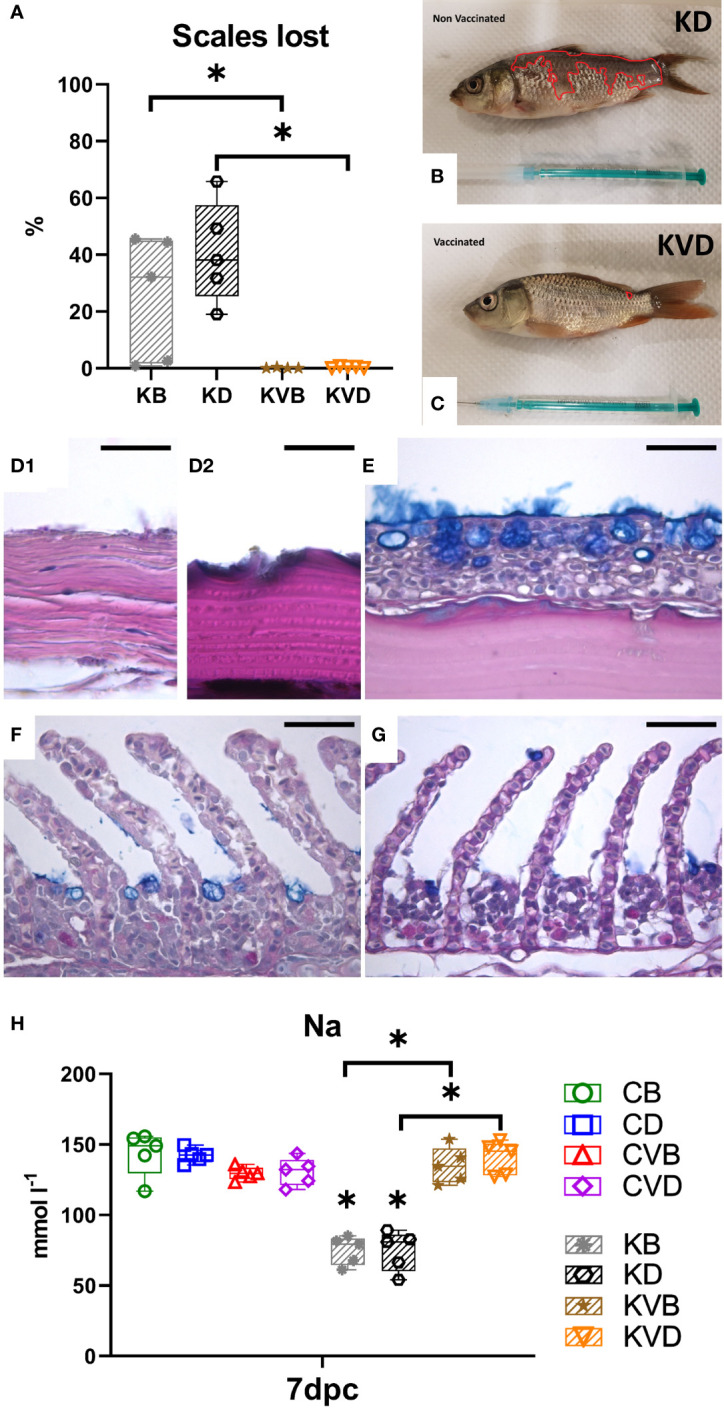
Figure 5.

Macroscopic, pathohistological and pathophysiological effect of the CyHV-3 challenge at 7 dpc. (A) Percentage of the body integument where scales were lost during the challenge. The surface area of (B) non-vaccinated and (C) vaccinated fish which lost scales are outlined in red. (D1) Histology of the skin of non-vaccinated, CyHV-3 challenged fish which lost scales. (D2) Histology of the skin of non-vaccinated, CyHV-3 challenged fish which had intact scales but lost the epithelium. (E) Histology of the skin of vaccinated fish showing scales covered with epithelium. (F) Histology of the gills of non-vaccinated, CyHV-3 challenged fish showing thickening of secondary lamella and some increase in cell proliferation in the intralammellar spaces. (G) Histology of the gills of vaccinated, CyHV-3 challenged fish showing secondary lamella of normal thickness and some increase in cell proliferation in the intralammellar spaces. (H) Sodium level in blood serum. The description of experimental groups: CB – BSA, non-vaccinated, unchallenged control, CD – defensins, non-vaccinated, unchallenged control, CVB – BSA, vaccinated, unchallenged control, CVD – defensins, vaccinated, unchallenged control, KB - BSA non-vaccinated, CyHV-3 challenged, KD – defensins non-vaccinated, CyHV-3 challenged, KVB – BSA, vaccinated, CyHV-3 challenged, KVD – defensins, vaccinated, CyHV-3 challenged. The results are presented as 25%-75% box plots with min. and max. values as whiskers with indication of all data points. * indicates statistical significant difference at p < 0.05. Statistical analysis was performed with one-way ANOVA with the multiple comparisons test performed with Holm-Sidak method.
