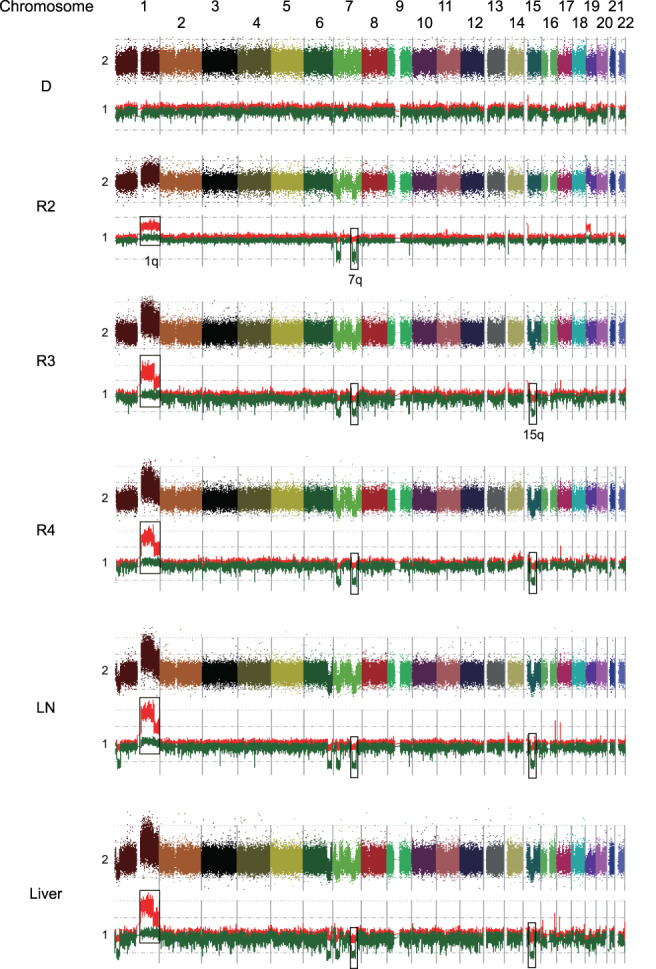
FIGURE 2.

Results of SNP array analysis in each sample. Colorful dots at the top represent signal of each probe (raw data). Red and green lines at the bottom show allele‐specific copy number, respectively. Consistent copy number alterations on chromosomes 1q, 7q, and 15q were detected. D, initial diagnosis; LN, lymph node; R2, second relapse; R3, third relapse; R4, fourth relapse
