FIGURE 2.

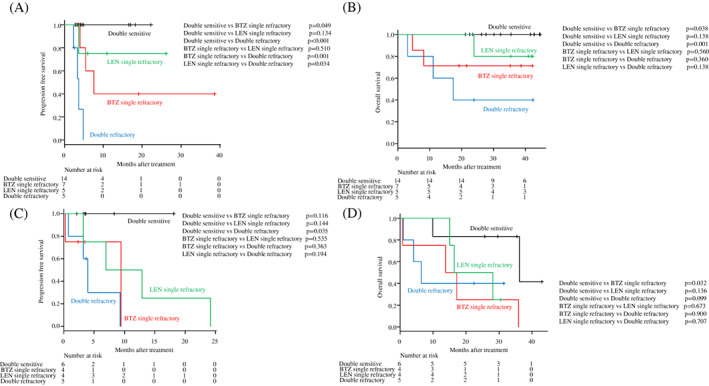
Kaplan–Meier curves for progression‐free survival (PFS) and overall survival (OS) for KRD (A; PFS, B; OS) and KD (C; PFS, D; OS) therapy, according to refractoriness to BTZ and/or LEN

Kaplan–Meier curves for progression‐free survival (PFS) and overall survival (OS) for KRD (A; PFS, B; OS) and KD (C; PFS, D; OS) therapy, according to refractoriness to BTZ and/or LEN