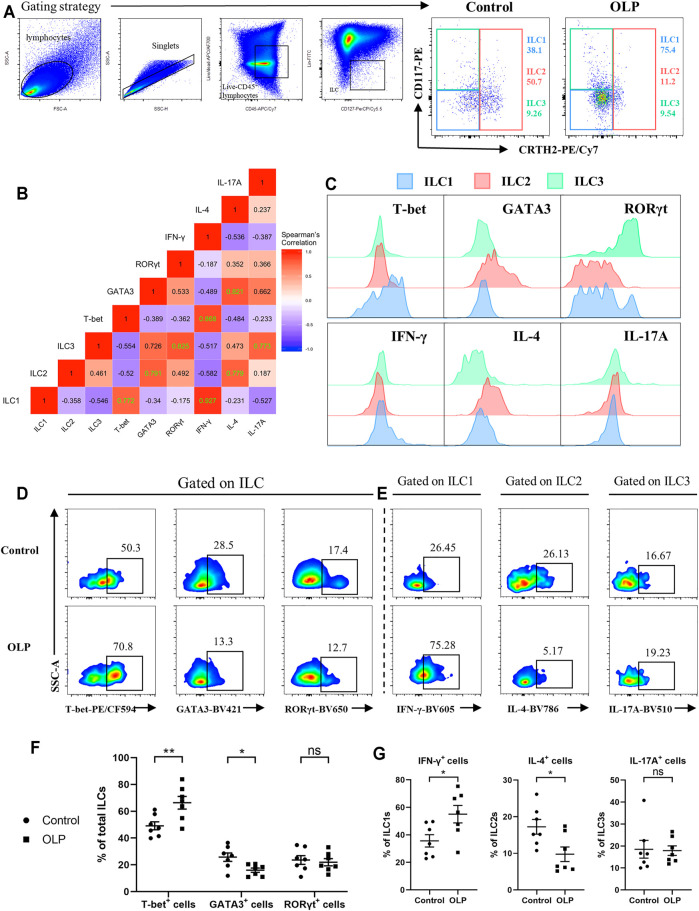
FIGURE 4.
Transcriptional and cytokine expression profiles of ILCs. PBMCs collected from OLP patients and healthy controls were stimulated with PMA/ionomycin/Brefeldin A for 6 h and then subjected to intracellular staining and flow cytometric analyses. (A) Gating strategy to define ILC1/2/3. (B) Correlation heatmap depicting expression of transcription factors/cytokines in ILCs (Spearman’s correlation coefficient, healthy controls). Statistically significant correlations (two-tailed p < 0.05) are denoted in green. (C) Representative histograms of healthy individuals depicting transcriptional and cytokine expression profiles of ILC1/2/3. Representative FACS plots of expression of T-bet, GATA3, and RORγt in total ILCs (D) as well as expression of IFN-γ in ILC1s, expression of IL-4 in ILC2, and expression of IL-17A in ILC3 (E) among control and OLP groups. (F) Percentages of T-bet+, GATA3+, and RORγt+ cells in ILCs. (G) Percentages of IFN-γ+ cells in ILC1s, IL-4+ cells in ILC2s, and IL-17A+ cells in ILC3s. Data are depicted as a bar graph with mean ± SEM. Two-tailed unpaired Mann–Whitney tests were performed, *p < 0.05, **p < 0.01. ILCs, innate lymphoid cells; PBMCs, peripheral blood mononuclear cells; OLP, oral lichen planus; PMA, phorbol 12-myristate 13-acetate; FACS, fluorescence-activated cell sorting.

