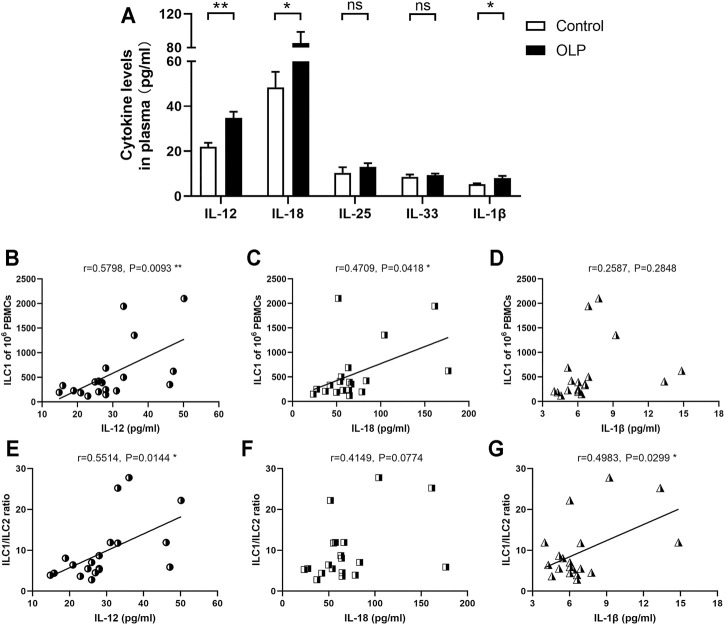
FIGURE 5.
Plasma levels of ILC-related activation factors. Plasma extracted from OLP patients and healthy controls was measured by ELISA kits. (A) The expression levels of IL-12, IL-18, IL-25, IL-33, and IL-1β. Correlation of the expression levels of IL-12, IL-18, and IL-1β with corresponding circulating ILC1 counts (B–D) or ILC1/ILC2 ratio (E–G). Data are depicted in correlation plots or as a bar graph with mean ± SEM. Two-tailed unpaired Mann–Whitney tests and Spearman’s rank correlation tests were performed, *p < 0.05, **p < 0.01. ILC, innate lymphoid cell; OLP, oral lichen planus.

