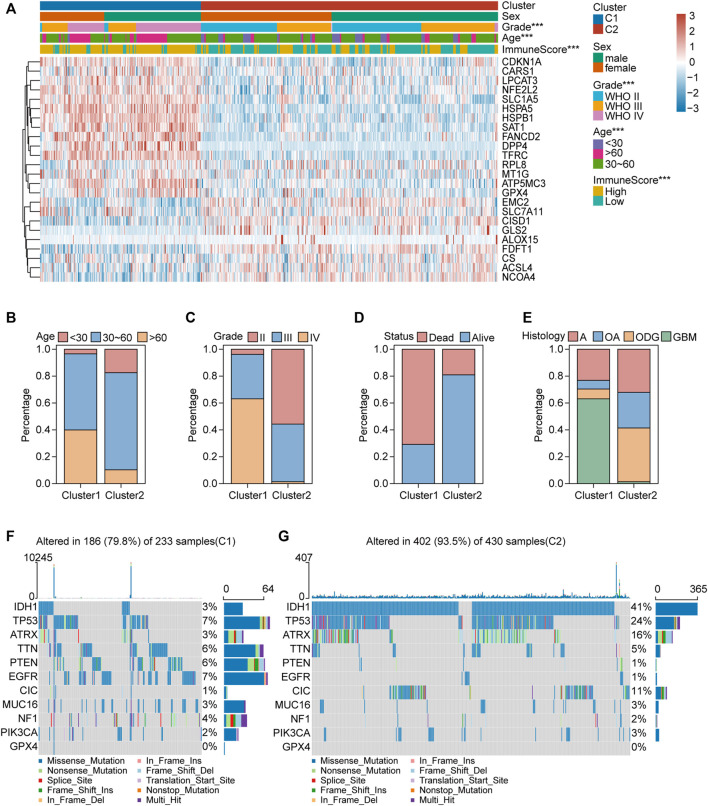
FIGURE 3.
Clinical features and somatic landscapes of two ferroptosis-related subtypes. (A) Heatmap visualized the distribution of sex, age, grade, immuneScore between the two ferroptosis-related subtypes. *p < 0.05; **p < 0.01; ***p < 0.001. (B–E) Histograms depicted the differences of age, grade, status and histology between two ferroptosis-related subtypes. (F,G) Oncoplot displaying the somatic landscape of glioma cohort of two ferroptosis-related subtypes. Genes are ordered by their mutation frequency, and samples are ordered according to disease histology as indicated by the annotation bar (bottom). Side bar plot shows log10 transformed Q-values estimated by MutSigCV. Landscape of mutation profiles in OC samples. Mutation information of each gene in each sample was shown in the waterfall plot, where different colors with specific annotations at the bottom meant the various mutation types. The bar plot above the legend exhibited the number of mutation burden.

