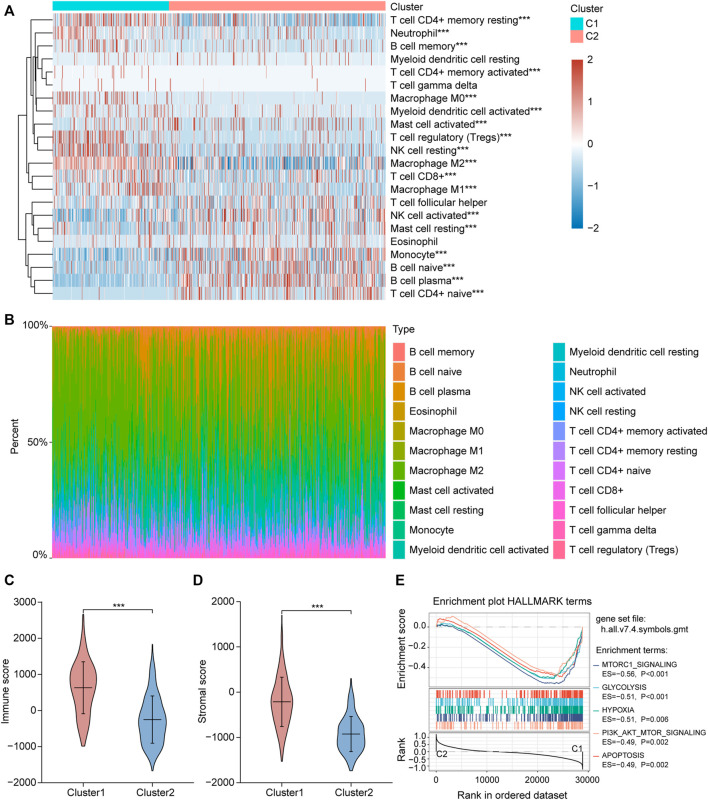
FIGURE 4.
Different immune cell infiltration between two ferroptosis-related subtypes. (A) Immune cell score heat map, where different colors represent the expression trend in each sample between two ferroptosis-related subtypes. *p < 0.05, **p < 0.01, ***p < 0.001. (B) The percentage abundance of tumor infiltrating immune cells in each sample, with different colors and different types of immune cells. The abscissa represents the sample, and the ordinate represents the percentage of immune cell content in a single sample. (C,D) Violin plots of the immuneScore and stromalScore between the two ferroptosis-related subtypes. *p < 0.05, **p < 0.01, ***p < 0.001. (E) The enrichment plots of representative Gene Set Enrichment Analysis (GSEA) results. ES, enrichment score.

