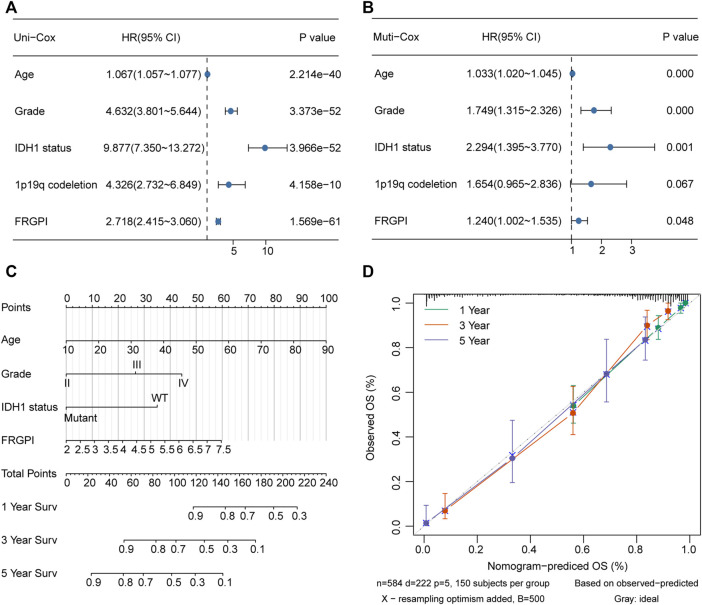
FIGURE 6.
Nomogram was constructed to calculated prognostic risk score for individual. (A,B) Hazard ratio and p-value of constituents involved in univariate and multivariate Cox regression for FRGPI, age, grade, IDH1 status and 1p19q codeletion in TCGA glioma samples. (C) Nomogram to predict the 1-, 3- and 5-year OS of glioma patients. (D) Calibration curve indicated that predicted 1-, 3- and 5-year survival rates were close to the actual survival rates. The gray dashed diagonal line represents the ideal nomogram, and the green line, red line and blue line represent the 1-, 3- and 5-y observed nomograms.

