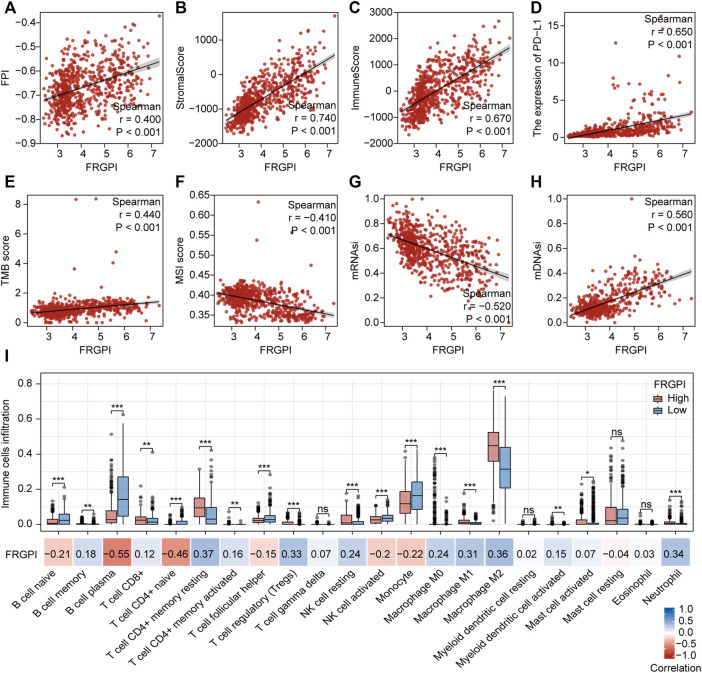
FIGURE 8.
Anti-tumor immunity and intrinsic immune escape associated with FRGPI. Spearman correlation coefficients and associated p-value of FRGPI with (A) FPI, (B) stromalScore, (C) immuneScore, (D) the expression of PD-L1, (E) TMB score, (F) MSI score, (G) mRNAsi, (H) mDNAsi are shown. r, Spearman coefficient; ns, no significance; *p < 0.05; **p < 0.01; ***p < 0.001. (I) Different immune cell infiltration between high and low FRGPI group, and the correlation between FRGPI and immune cells infiltration. ns, no significance; *p < 0.05; **p < 0.01; ***p < 0.001; blue, positive correlation; red, negative correlation.

