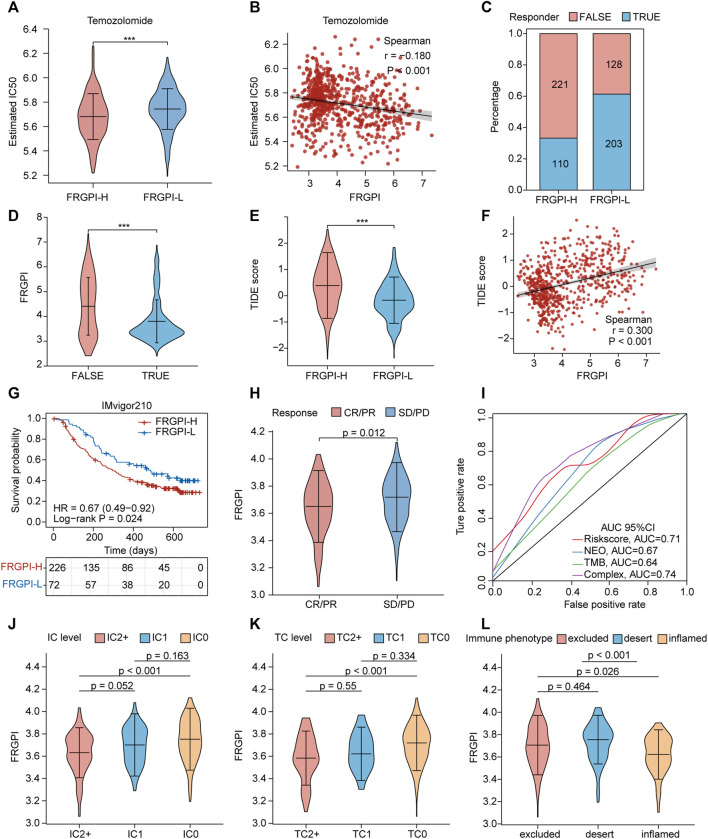
FIGURE 9.
FRGPI is predictive of temozolomide sensitivity and ICI response in glioma. (A) Different estimated temozolomide IC50 between high and low FRGPI group. (B) The spearman correlation between FRGPI and estimated temozolomide IC50. The ICI response of each patient in high and low FRGPI group was predicted by TIDE algorithm, (C) stacked histogram showed the distribution of “TURE” or “FALSE” responder in high and low FRGPI group; (D,E) Violin plots showed the FRGPI level of “TURE”- and “FALSE”-responder group, and the different TIDE score between high- and low-FRGPI group. (F) The spearman correlation between FRGPI and TIDE score. (G) Kaplan–Meier curves showing overall survival in patients with low or high FRGPI in the anti-PD-L1 cohort. (H) The distribution of FRGPI in distinct anti-PD-L1 clinical response groups. (I) Roc curves showing predicting value of FRGPI, neoantigen (NEO), TMB and complex (FRGPI combined with NEO and TMB) group for anti-PD-L1 therapy response. CR, complete response; PD, disease progression, PR, partial response; SD, stable disease. (J–L) Distribution of the FRGPI in distinct IC-level, TC-level and immune-phenotype group respectively in the anti-PD-L1 cohort. IC-level, PD-L1 expression level on immune cells; TC-level, PD-L1 expression level on tumor cells.

